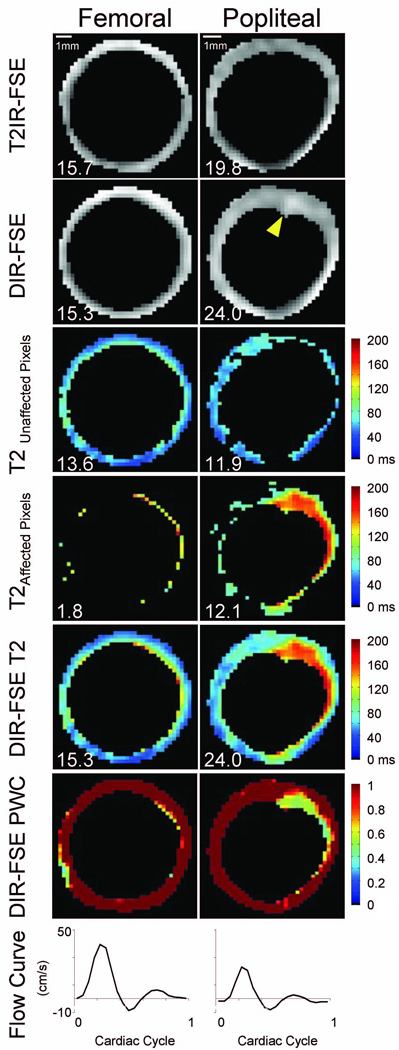
Figure 5.
Representative data set highlighting DIR-FSE popliteal blood artifact. Top row: segmented T2IR-FSE images at effective TE = 9.4 ms; second row: segmented DIR-FSE images at effective TE = 9.4 ms; third row: DIR-FSE T2 maps for unaffected vessel wall pixels; fourth row: DIR-FSE T2 maps for pixels affected by slow flowing blood; fifth row: collective DIR-FSE T2 maps; sixth row: DIR-FSE partial wall content (PWC) maps; and bottom row: blood velocity curves. The arrowhead in the DIR-FSE popliteal image indicates an area of incomplete blood suppression. The scale is indicated in the top row. Corresponding areas (in mm2) are inset for reference.

