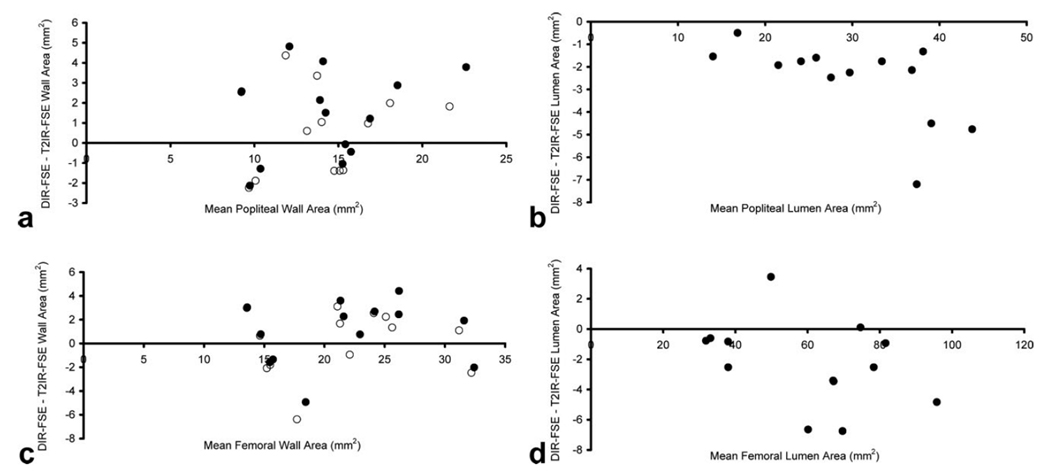
Figure 6.
Bland-Altman plots of wall area (a, b) and lumen area (c, d) measurements obtained with 2D DIR-FSE and T2IR-FSE imaging. Before DIR-FSE partial wall content correction (solid circles), agreement was 1.4 ± 2.2 mm2 for the popliteal wall (a) and 0.9 ± 2.7 mm2 for the femoral wall (b). After DIR-FSE partial wall content correction (open circles), agreement was 0.6 ± 2.1 mm2 for the popliteal wall and 0.2 ± 2.8 mm2 for the femoral wall. Popliteal lumen area bias was −2.6 ± 1.8 mm2 (c) while femoral lumen area bias was −2.3 ± 2.8 mm2 (d).

