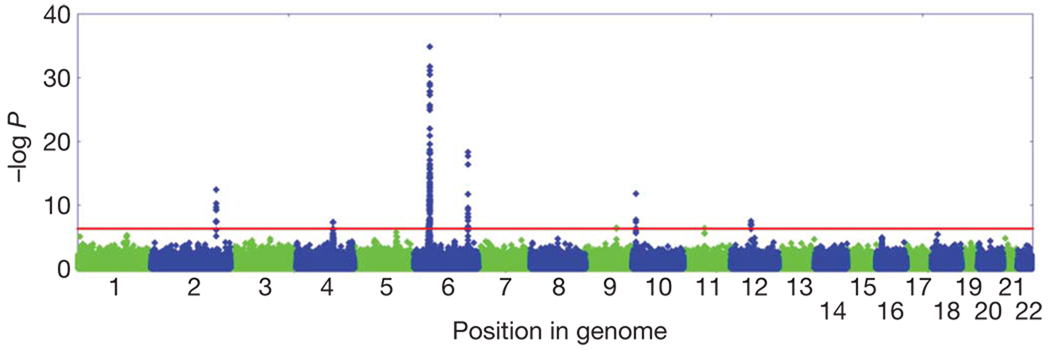
Figure 1. Manhattan plot of the joint analysis of the discovery GWAS and the replication GWAS.
Results are plotted as negative log-transformed P values from a genotypic association test controlled for residual population stratification as a function of the position in the genome. Odd chromosomes are in green and even chromosomes in blue. Eight genomic regions contain SNPs that exceed the genome-wide significance threshold of 5 × 10⁻⁷ (red line).

