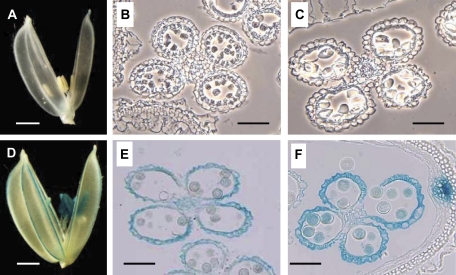
Fig. 2.
Analysis of OsSUT1 expression in the glumaceous flowers of transgenic plants harbouring a OsSUT1 promoter::GUS construct. (A, D) Whole glumaceous flowers at stage I (A) and stage III (D). Bars indicate 1 mm. (B, C, E, F) Cross-sections of anthers of various developmental stages; (B) earlier than stage I (around 10 DTA), (C) stage I, (E) stage II, (F) stage IV. Bars indicate 0.1 mm. (B) and (C) are phase-contrast images to show the anatomy of the anthers better.

