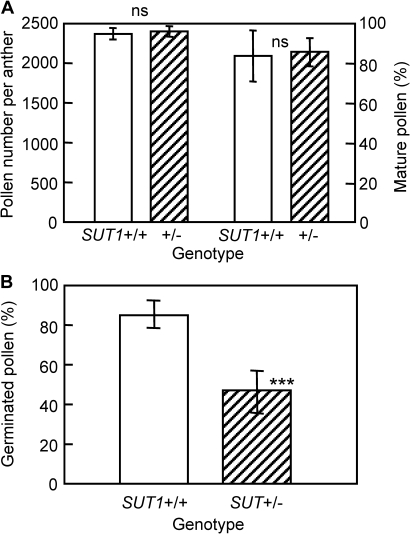
Fig. 4.
Total number, maturity, and germination rate of the pollen of SUT1+/+ or SUT1+/– plants of the insertion mutant line NF2752. (A) The number of pollen (left) and the percentage of matured pollen (right) in an anther. Measurements of seven glumaceous flowers per plant were averaged and processed as the value of each plant, and the means of five individual plants for each genotype were plotted. Vertical bars indicate SD, and ‘ns’ shows not significantly different between the two genotypes (t test). (B) The in vitro pollen germination rate of SUT1+/+ or SUT1+/– plants. Five to seven observations per plant were averaged and processed as the value of each plant, and the means of 16 individual plants for each genotype were plotted. Vertical bars indicate SD, and the asterisks (***) show significant difference by t test (P <0.001).

