Fig. 5.
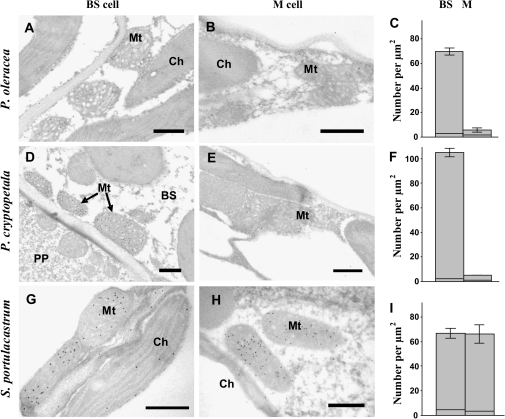
Electron microscopy of in situ immunolocalization of glycine decarboxylase (GDC) in chlorenchyma cells of P. oleracea (A, B), P. cryptopetala (D, E), and Sesuvium portulacastrum (G, H), and graphs showing the density of labelling for GDC in BS versus M mitochondria (right panels C, F, and I). (A, D, G) Immunolabelling of GDC in bundle sheath cell mitochondria. (B, E) Lack of immunolabelling for GDC in M cells of two Portulaca species, and (H) showing the presence of gold particles in M mitochondria in S. portulacastrum. (C, F, I) In all graphs the x-axis represents the number of gold particles per μm2 of mitochondrial area; for each cell type 10–60 cell fragments were used for counting. The horizontal lines near the base of the bars represent the level of background (number of particles per cell fragment area excluding mitochondria). BS, bundle sheath cell; Ch, chloroplast; M, mesophyll; Mt, mitochondria; PP, phloem parenchyma cell. Scale bars: 0.5 μm.

