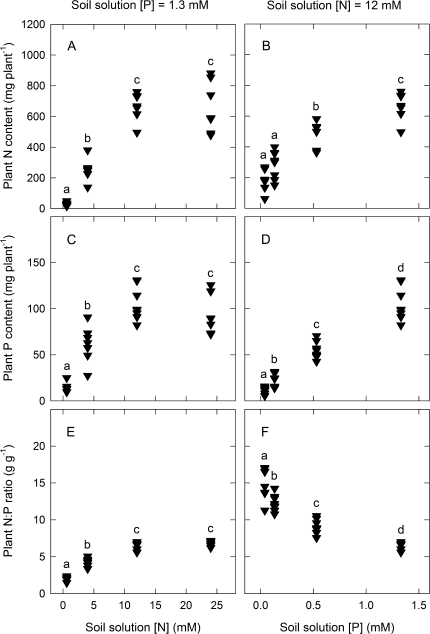
Fig. 2.
Nitrogen content per plant (A and B), phosphorus content per plant (C and D), and plant nitrogen to phosphorus ratio (E and F) of Ficus insipida seedlings as a function of variation in the nitrogen and phosphorus concentration of nutrient solutions fed to the plants. The left-hand panels (A, C, and E) show variation as a function of nutrient solution nitrogen concentration with nutrient solution phosphorus concentration held constant at 1.33 mM. The right-hand panels (B, D, and F) show variation as a function of nutrient solution phosphorus concentration with nutrient solution nitrogen concentration held constant at 12 mM. Different lower case letters within a panel indicate significantly different means at P <0.05.

