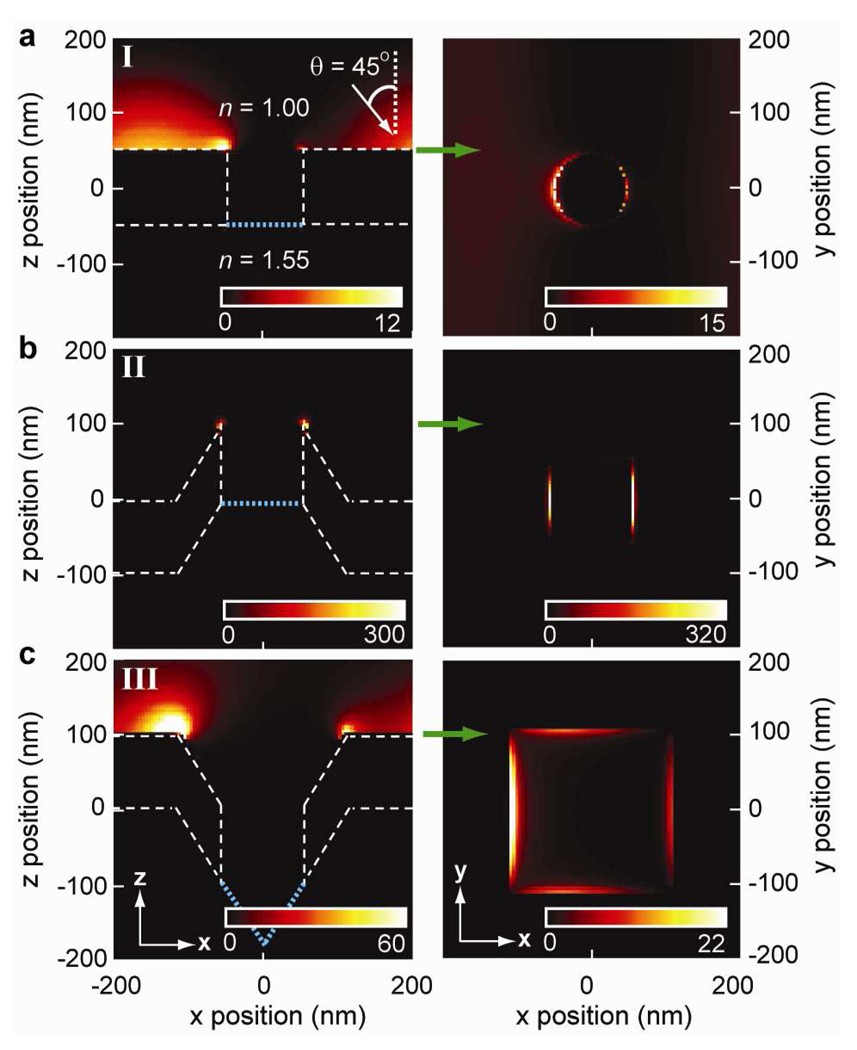
Figure 3. Strong LSPs are generated on protruding hole arrays under oblique excitation.
Electric field intensities (|Ez|2) calculated by FDTD on (a) planar hole arrays at λ (I) = 705 nm, (b) protruding hole arrays at λ (II) = 695 nm, and (c) recessed hole arrays at λ (III) = 700 nm from Fig. 2. The white dashed lines outline the metal-dielectric interface. The blue dotted lines depict the air-PU interface. The green arrows show the z position of the x-y plane images.

