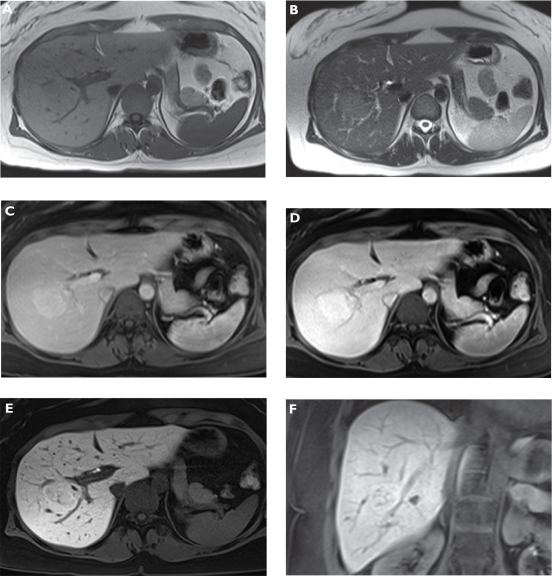
Figure 2.
Focal nodular hyperplasia (FNH). Plain T1-weighted spoiled 2D gradient echo (GRE) A) T2-weighted half-Fourier acquisition single-shot turbo spin-echo (HASTE) B) arterial-phase gadoxetic acid-enhanced fat-suppressed (FS) T1-weighted spoiled 3D GRE C) portal venous-phase gadoxetic acid-enhanced FS T1-weighted spoiled 3D GRE D) hepatocellular phase in the axial E) and coronal plane F) gadoxetic acid-enhanced FS T1-weighted spoiled 3D GRE 20 min following contrast injection. The liver demonstrates a lesion in the right liver lobe, which is slightly hypointense compared with liver on T1-weighted A) and hyperintense compared on T2-weighted imaging B). The tumor enhances on dynamic images (C and D) and signal intensity stays high on late phase images due to hepatocellular uptake (E and F) characterizing the lesion as FNH.

