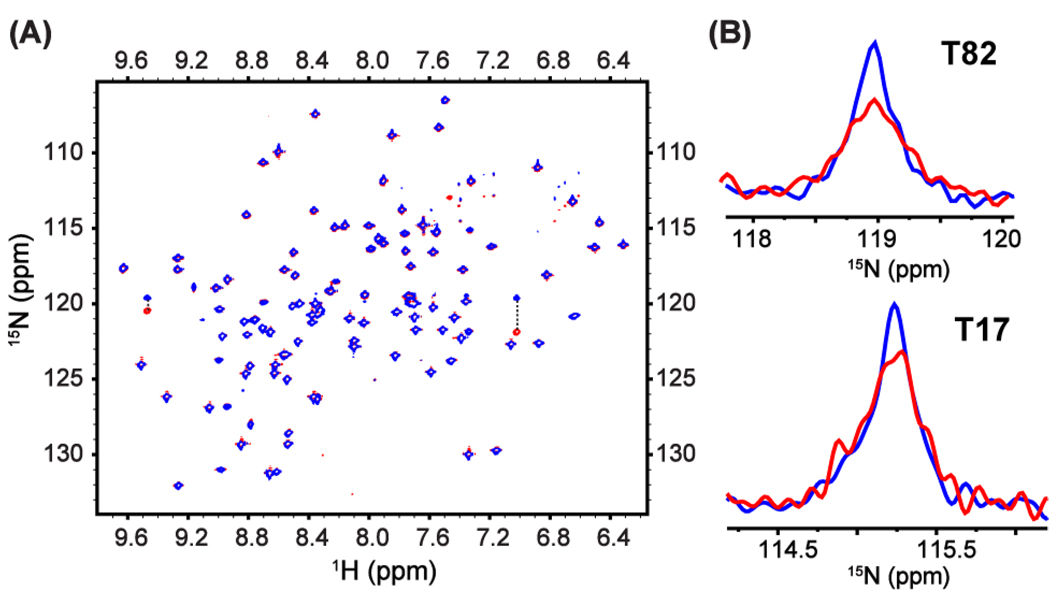
Figure 2.
(A) Overlay of spectra for normal TROSY (red) and TROSY with CSS (blue) during the t1 evolution period. Data were acquired for [U-2H, U-15N] RNase A at 293 K on a Bruker DRX500 spectrometer equipped with a triple-resonance gradient probe. The parameters used for chemical shift scaling are τ90 = 100 µs, τ1 = 200 µs, τ2 = 3 µs, τ3 = 50 µs, and σ = 0.42. Data were processed without apodization in indirect dimensions. Crosspeaks connected by dotted lines belong to same residues and are outside the effective bandwidth and also aliased. (B) The 15N lineshapes of residues T82 and T17 in normal TROSY (red) and TROSY with CSS (blue).

