
Figure 2. Behavioral performance on a backward masking task.
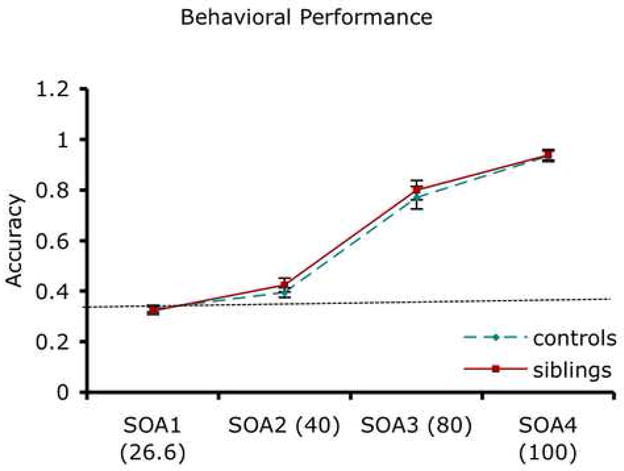
The mean (standard error, SE) performance of siblings and controls is shown for the 4 SOAs. Both groups showed increased accuracy with increasing SOAs (i.e., decreased masking effect) and the groups did not differ significantly at any SOA. Chance performance is 33% (indicated by a dotted line). Values are presented as mean (SE).