
Figure 4. Whole brain analyses.
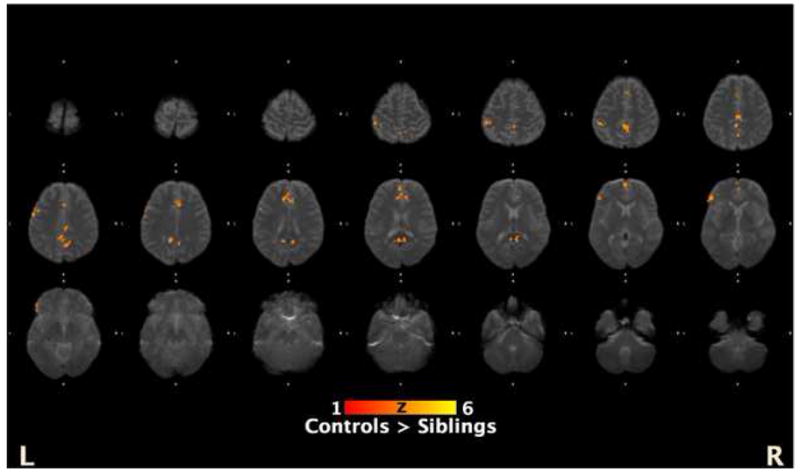
This figure shows the areas that controls showed increased activations compared with siblings from the exploratory whole brain analysis of regions that showed a parametric increase with increased SOAs (SOA 1,2 < SOA 3 < SOA 4). The coordinates of the regions are presented in Table 2.