
Figure 2. Characterization of non-NMDA EPSCs in mEC Superficial Layer Neurons.
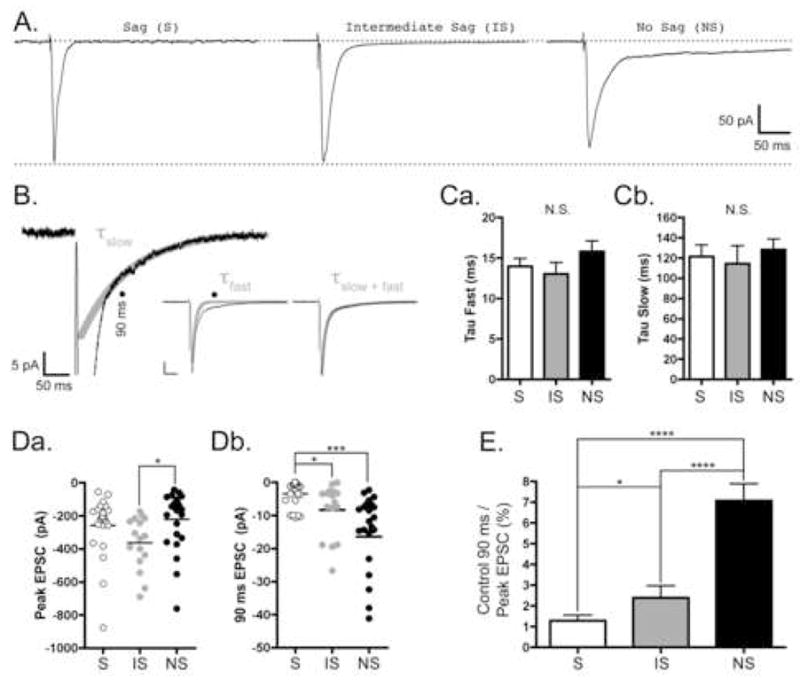
Neurons were voltage clamped at −70 mV, and low frequency (0.1–0.2 Hz) stimuli were used to evoked EPSCs as described in Materials and Methods. All traces were recorded in the presence of 50 μM APV, 50 μM PTX, and 200–400 nM CGP 54626 and are the average of 15–30 responses. A, Representative traces from Sag (S), Intermediate Sag (IS), and No Sag (NS) Neurons. Scale bars located at far right apply to all traces. Upper dashed line represents baseline current before stimulation, and lower dashed line represents the amplitude of the peak non-NMDA EPSC from the S neuron. In contrast to the S and IS neurons, there is a large slow-decay component to the EPSC in the NS neuron. B, Representative trace from a NS neuron illustrating the kinetics of the fast and slow phases of the EPSC decay. Only the first 20 pA of the EPSC are shown. The black line represent the trace and the thick grey line represent the slow phase of the fitted data (τslow). Black lines in the Insets show the entire EPSC and thick grey lines show either the fast phase of the EPSC (τfast) or the two phase exponential fit (τfast+slow). Scale bar in inset represents 50 pA and 50 ms. Solid circles indicate the 90 ms time point after the peak of the EPSC used in later calculations. C, Bar graphs representing the average time constants (τ ± SE) for the fast phase, Ca, and the slow phase, Cb, of the EPSC decay for each of the cell types in the superficial mEC. S, IS, and NS data are represented by white, grey, and black bars, respectively. Differences between the cell types were not significant (N.S.) for either measure. The fast time constants (ms) for S, IS, and NS neurons were 14.0±1.0 (N=14), 13.0±1.4 (N=16), and 15.8±1.3 (N=14), respectively. The slow time constants (ms) for S, IS, and NS neurons were 121.2±11.7 (N=11), 114.4±17.6 (N=8), and 128.4±10.3 (N=11), respectively. D, Scatter plots showing the EPSC amplitudes at the peak, Da, and 90 ms after the peak, Db, for each cell type in the superficial mEC. S, IS, and NS data are represented by white, grey, and black circles, respectively. Mean peak amplitudes (pA) are represented by horizontal lines and are −258.9±38.2 (N=23), −363.1±39.7 (N=16), and −221.9±35.9 (N=24) for S, IS, and NS neurons, respectively. The difference between IS and NS neurons was significant (*, p<0.05). Mean amplitudes at 90 ms after the peak (pA) are represented by horizontal lines and are −3.5±0.8 (N=23), −8.3±2.0 (N=16), and −14.1±2.3 (N=24) for S, IS, and NS neurons, respectively. The difference between S and IS neurons (*, p<0.05), as well as S and NS neurons (***, p<0.001), was significant. E, Bar graph representing the relative amplitude of the EPSC at 90 ms as a percentage of the peak. S, IS, and NS data are represented by white, grey, and black bars, respectively. On a neuron-by-neuron basis, the amplitude of the EPSC at 90 ms was 1.2±0.2% (N=23), 2.4±0.6% (N=16), and 7.1±0.8% (N=24) of the peak for S, IS, and NS neurons, respectively. The differences between S and NS neurons, as well as between IS and NS neurons, was significant (****, p<0.0001). Additionally, the difference between S and IS neurons was significant (p < 0.05).