
Figure 4. GYKI-resistant EPSCs are inhibited by 10 μM CNQX.
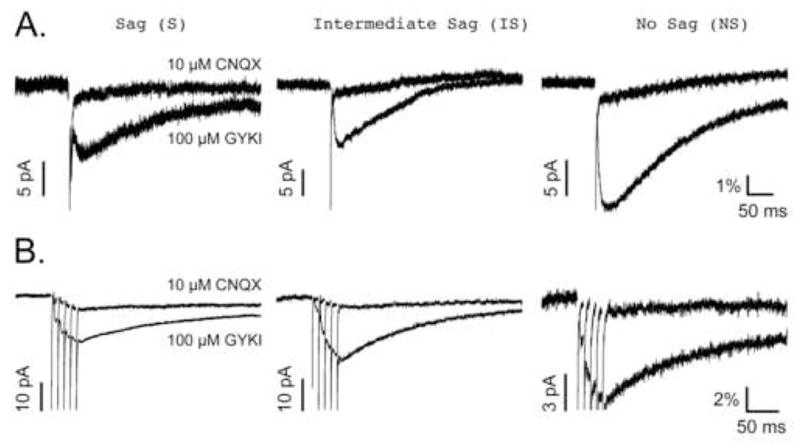
All traces are the average of 15–30 responses under each condition. A, GYKI-resistant and CNQX-resistant EPSCs evoked by low frequency (0.1–0.2 Hz) stimulation. B, GYKI-resistant and CNQX-resistant EPSCs evoked by high frequency (5 stimuli at 100 Hz) stimulation. The amplitudes of the EPSCs share a common scale bar associated with the NS neuron traces in both panels. These scale bars represent the relative contribution of the GYKI-resistant EPSCs to the control EPSC (% of control) as described in Materials and Methods. An additional scale bar representing the varying amplitudes (pA) of each set of traces is shown to the left of the GYKI-resistant EPSC peaks in all cases. Note that regardless of the stimulation protocol used, the NS neuron’s GYKI-resistant EPSC contributes more to the control non-NMDA EPSC than do those from either S or IS neurons.