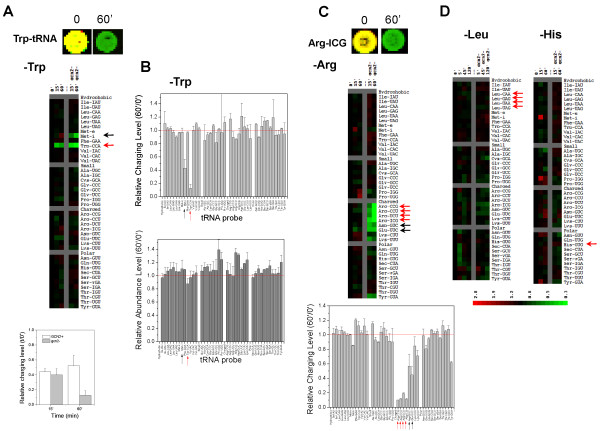
Figure 2.
Changes in tRNA charging profile correlate with growth phenotype. Cognate tRNAs for the amino acid depleted are indicated by red arrows. Non-cognate tRNAs whose charging also changes significantly are indicated by black arrows. (A) Trp depletion. Top: array spot for the Trp-tRNA probe; Middle: heatmap of the wild-type and isogenic gcn2Δ strains; Bottom: histogram of the relative charging level of tRNATrp before and after Trp depletion. (B) Comparison of the changes in tRNA charging (top) and tRNA abundance (bottom) before and after 60 min of Trp depletion of the gcn2Δ strain. Both tRNATrp and initiator tRNAiMet exhibited a large decrease in charging, but not in abundance. (C) Arg depletion. Top: array spot for the Arg-tRNA (anticodon ICG) probe; Middle: heatmap of the wild-type and isogenic gcn2Δ strains; Bottom: histogram of the relative charging level before and after 60 min of Arg depletion for the gcn2Δ strain. (D) Leu and His depletion showed no significant decrease in tRNA charging.

