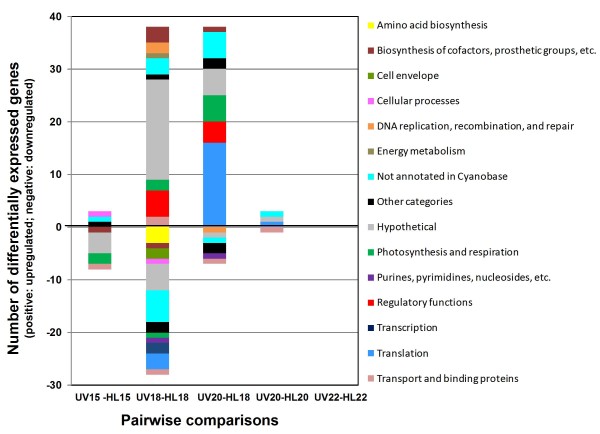
Figure 4.
Functional categories of the differentially regulated genes for the different pairwise timepoint comparisons. LIMMA and Student's t-test were used to perform pairwise comparisons of different samples (UV15 vs. HL15, UV18 vs. HL18, UV20 vs. HL20, UV22 vs. HL22, UV20 vs. HL18) and genes with a log2(FC) > 1 and an adjusted p-value (FDR ≤ 0.1) with either one of these methods were selected to draw the bar chart.

