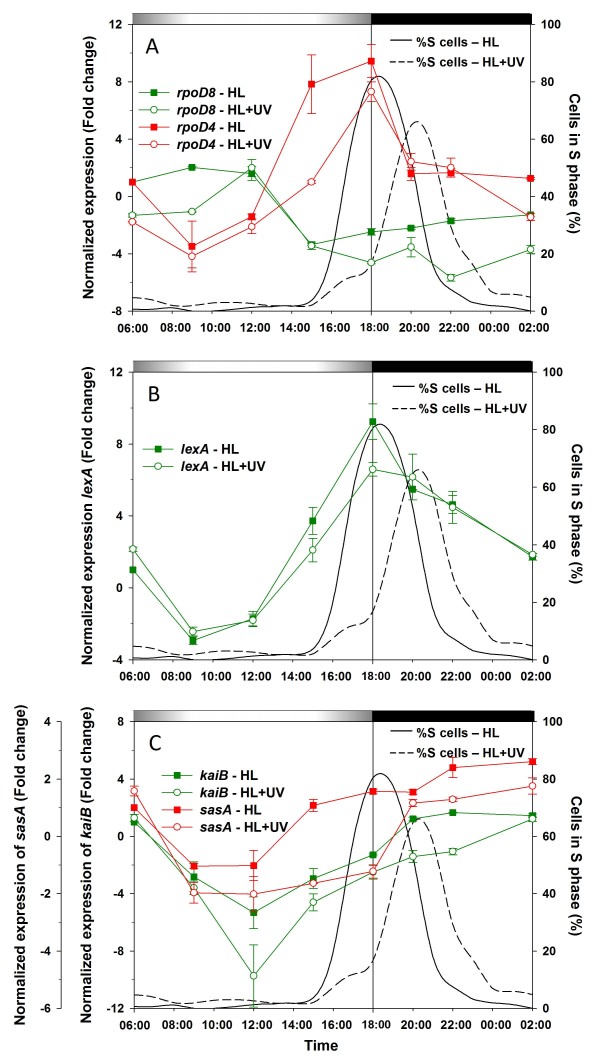
Figure 8.
Gene expression patterns of L/D-synchronized Prochlorococcus marinus PCC9511 cultures under HL and UV growth conditions, as measured by qPCR. A, rpoD8 and rpoD4. B, lexA. C, kaiB and sasA. The percentage of cells in the S phase of the cell cycle under HL (solid line) and HL+UV (dashed line) are also shown for comparison. Error bars indicate mean deviation for two biological replicates. For each graph, transcript levels were normalized to the reference time point 6:00 in HL condition. Grey and black bars indicate light and dark periods.

