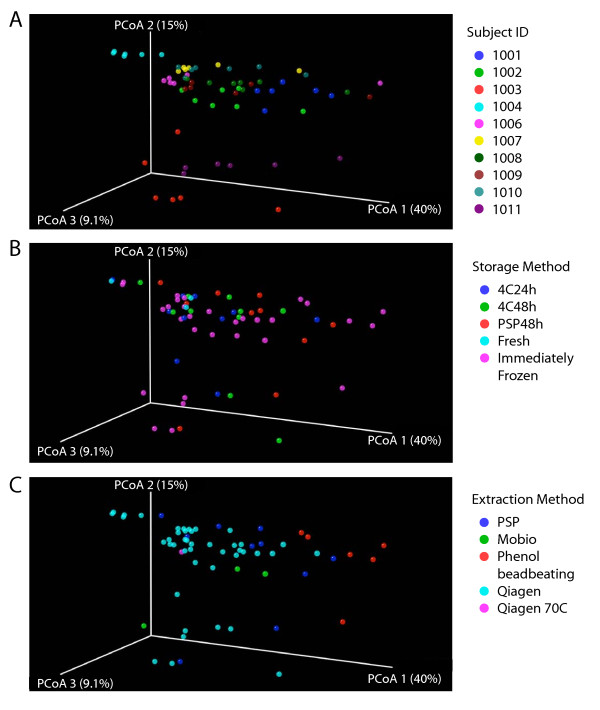
Figure 4.
Comparison of the relative abundance of different bacterial taxa under the conditions tested using weighted UniFrac. Weighted UniFrac was used to generate a matrix of pairwise distances between communities, then a scatterplot was generated from the matrix of distances using Principal Coordinate Analysis. The same scatterplot is shown in A)-C), but colored by subject A), storage method B), or extraction method C). The P-values cited in the text were generated using distances from the original UniFrac matrix.

