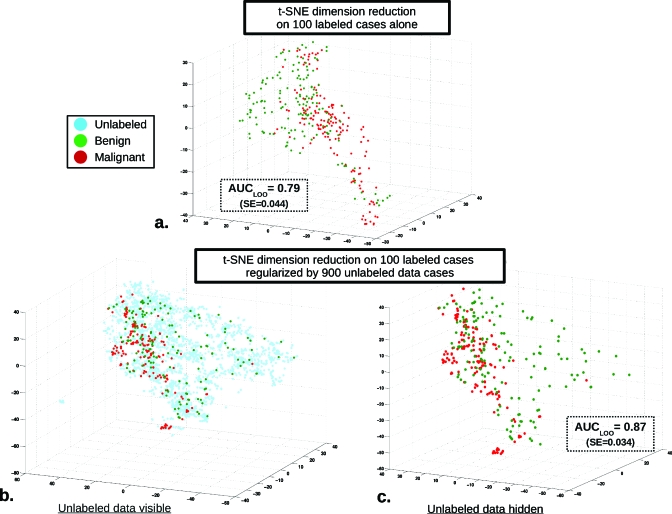
Figure 4.
Example 3D visualization of the incorporation of unlabeled data for classifier regularization using t-SNE DR alongside the AUCLOO classification performance for a single run data set (out of the total 200 generated) with 100 L cases and 900 UL. The three dimensions visualized are simply the first three embedding dimensions produced of the total 5D t-SNE DR. (a) Displays t-SNE DR mapping conducted with labeled data only, while for (b) and (c), unlabeled data are incorporated during the mapping. For this particular single run, classification performance as estimated by AUCLOO increased from 0.79 (SE=0.044) without the use of unlabeled data to 0.87 (SE=0.034) when unlabeled data are included during the DR mapping. However, this single run is not representative of the entire set or average performance; rather, it is a single positive performance change example, a broad distribution of performances exists for the entire set of runs conducted (see Fig. 5).

