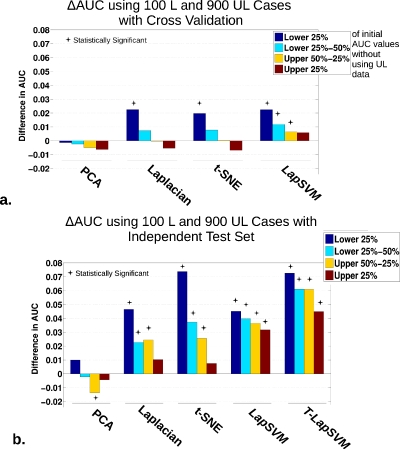
Figure 9.
Using 100 L cases during training and highest number of UL cases (900 UL), displayed are the differences in AUC [ΔAUC=AUC(with UL data)−AUC(without UL data)] organized according to a quartile decomposition of the initial AUCCV∕Ind performance without the use of unlabeled data (lower 25% in blue, lower 25%–50% in light blue, upper 50%–25% in orange, and upper 25% in dark red), highlighting classifier regularization trends. Statistically significant differences from ΔAUC=0 using a paired, nonparametric Wilcoxon signed-rank test, with consideration for multiple-hypothesis testing by employing the Holm–Sidak correction, are indicated by the * above the bars (setting α=0.05 or for adjusted p-values<0.05). The plots show (a) the cross-validation performance and (b) the independent test set performance.

