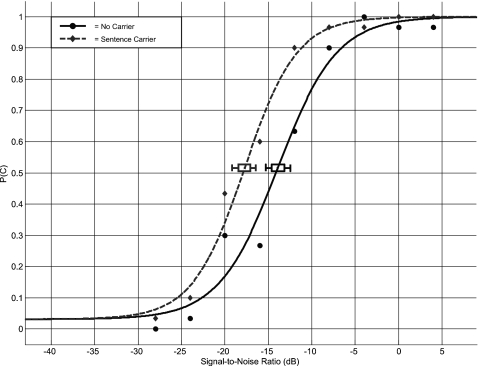
Figure 3.
Proportion of correct responses, P(C), as a function of signal-to-noise ratio for a single listener (LIS) in Exp. I. Data from the moderately reverberant room (R2) for both the NC and SC conditions are shown, along with logistic function fits for each condition (see text for details). Each data point is based on responses from 30 trials. Speech reception threshold estimates and their 95% confidence intervals are indicated for each curve at the midpoint between chance and perfect performance.

