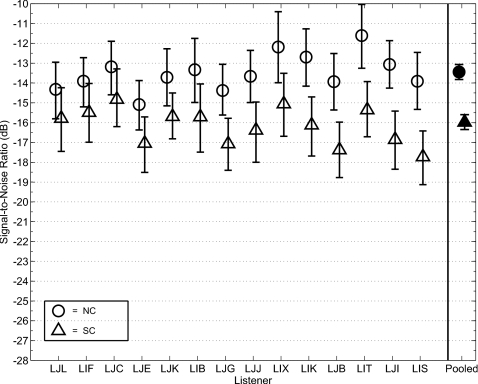
Figure 4.
Speech reception thresholds from Exp. I for the NC and SC conditions in room R2. 95% confidence intervals are displayed for each threshold estimate. Listeners are rank-ordered from left to right by effect size (NC threshold–SC threshold). Threshold values based on function fits to the data pooled across all listeners are shown on the right.

