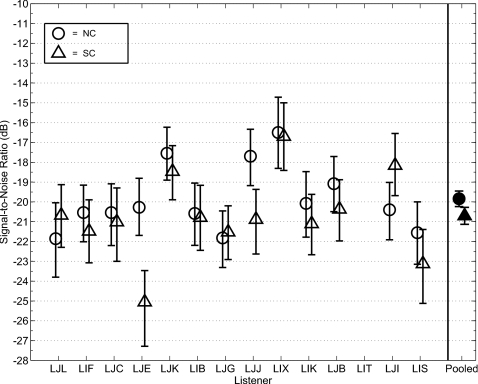
Figure 5.
Speech reception thresholds from Exp. II for the NC and SC conditions in anechoic space (R0). 95% confidence intervals are displayed for each threshold estimate. The left to right listener order is the same as shown in Fig. 4, except that listener LIT did not participate in Exp. II. Threshold values based on function fits to the data pooled across all listeners are shown on the right.

