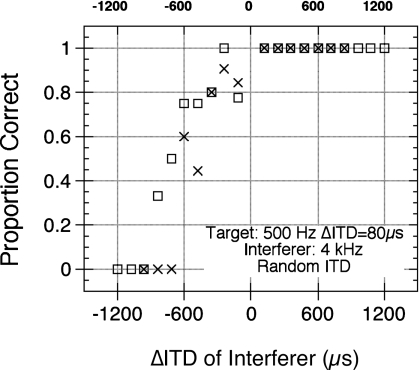
Figure 3.
The proportion of correct lateralization responses for the target is plotted as a function of the change in ITD of the interferer. Where the abscissa is negative, change in interaural disparity of the interferer was in the opposite direction to that of the target. Where the abscissa is positive, change in the interaural disparity of the interferer and that of the target were in the same direction. For this example (Obs 1), an 80 μs change in ITD was applied to the 500-Hz target. Trials in which the target led in the left (x) or right (◻) ear during the first interval are plotted separately.

