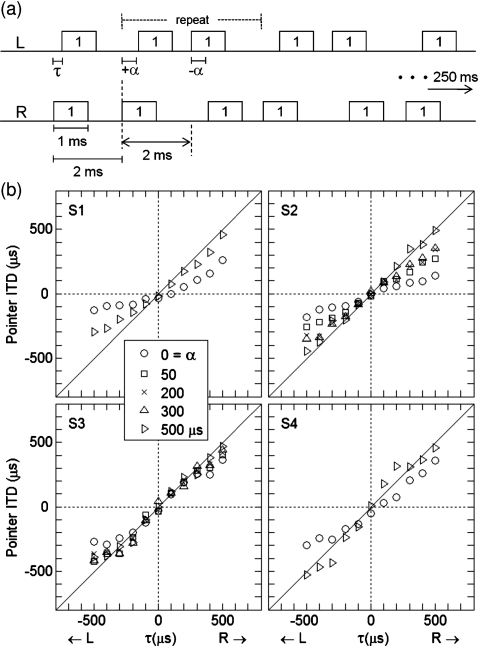
Figure 4.
Stimuli and results for Experiment 1-D. (a) As in Fig. 1a, but in this experiment the ITDs of the bursts after the first pair alternated between +α and −α μs, while τ was varied from −500 to +500 μs in 100-μs steps. The second burst pair in the train, which began the alternation between plus and minus α, was always right leading. Stimuli were abruptly gated. (b) Pointer adjustments from four listeners plotted as a function of τ. Only mean matches are shown for each condition. Note that the results for α=0 and α=500 μs were taken from Experiments 1-C and 1-B, respectively.

