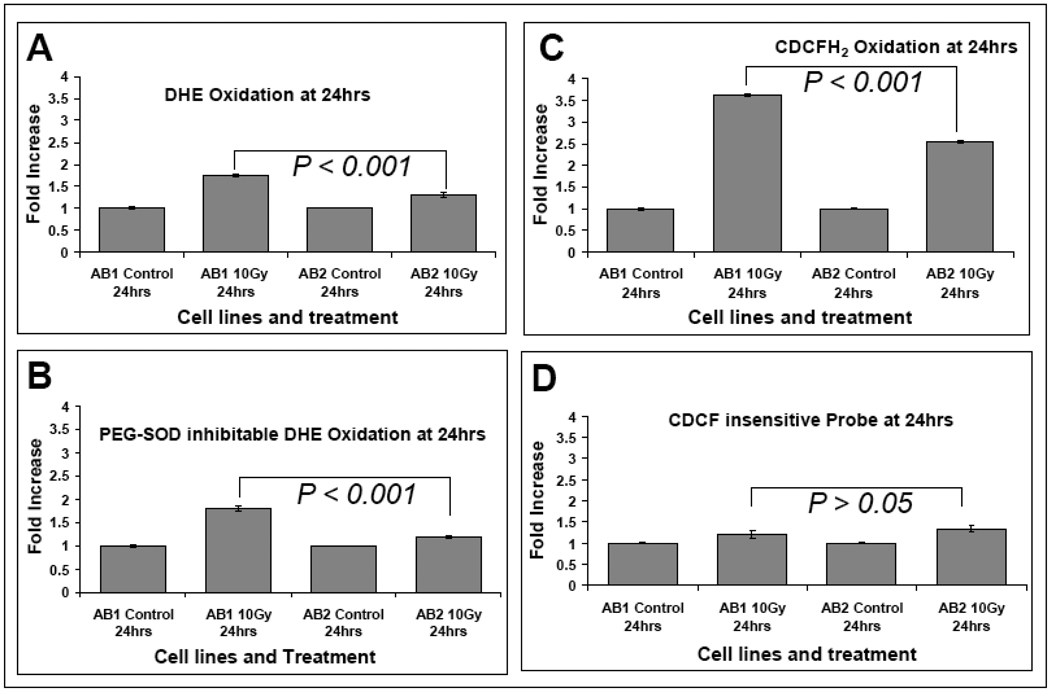
Figure 3. Sag disruption increases ROS levels following exposure to radiation.
ES cells with the Sag+/+ (AB2) and Sag−/− (AB1) genotype were left untreated or exposed to 10 Gy radiation (Cs137 at 0.75 Gy/min). Cells were labeled with DHE as described in the Methods 24 following radiation (panels A & B, 5 µM for 40 min) or CDCFH2/CDCF (10 µg/mL for 15 mins) (panels C & D). The oxidation insensitive probe (CDCF) was used to control for potential changes in probe uptake, ester cleavage, or efflux to ensure that changes in fluorescence seen with CDCFH2 could be attributed to changes in probe oxidation. For measurement of PEG-SOD inhibitable DHE oxidation (panel B), PEG-CuZnSOD (100 U/ml) was given 2 hours before and during DHE labeling. Ten thousand cells from each sample were then analyzed for Mean Fluorescence Intensity (MFI) by flow cytometry. PEG-SOD inhibitable DHE oxidation was obtained by calculating the difference between DHE oxidation in the presence or absence of PEG-SOD. Each data point represents the mean ± SEM from two independent experiments, each run in triplicate.

