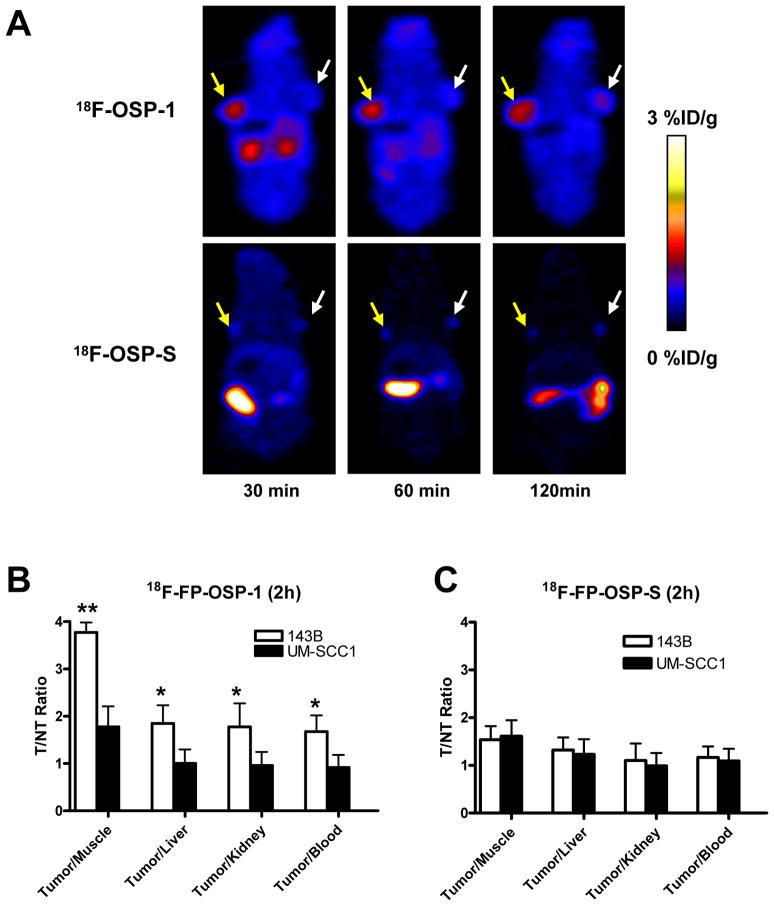
Fig. 5.
In vivo imaging of transplanted tumors by OSP-1 and OSP-S. A, Decay-corrected whole-body coronal microPET images of 143B and UM-SCC1 tumor-bearing mice at 30, 60 and 120 min after injection of 3.7MBq (100 μCi) of 18F-FP-OSP-1 or 18F-FP-OSP-S. The images shown are 5-min static scans of a single mouse, which is representative of the six mice tested in each group (yellow arrows indicate 143B tumors and white arrows indicate UM-SCC1 tumors). B and C, Comparison of tumor to muscle, liver, kidney and blood ratios of 18F-FP-OSP-1 or 18F-FP-OSP-S at 120 min after injection of 3.7 MBq (100μCi) tracer in 143B and UM-SCC1 tumor-bearing mice (n=6 per group) as measured by PET imaging (**, P<0.01; *, P<0.05).

