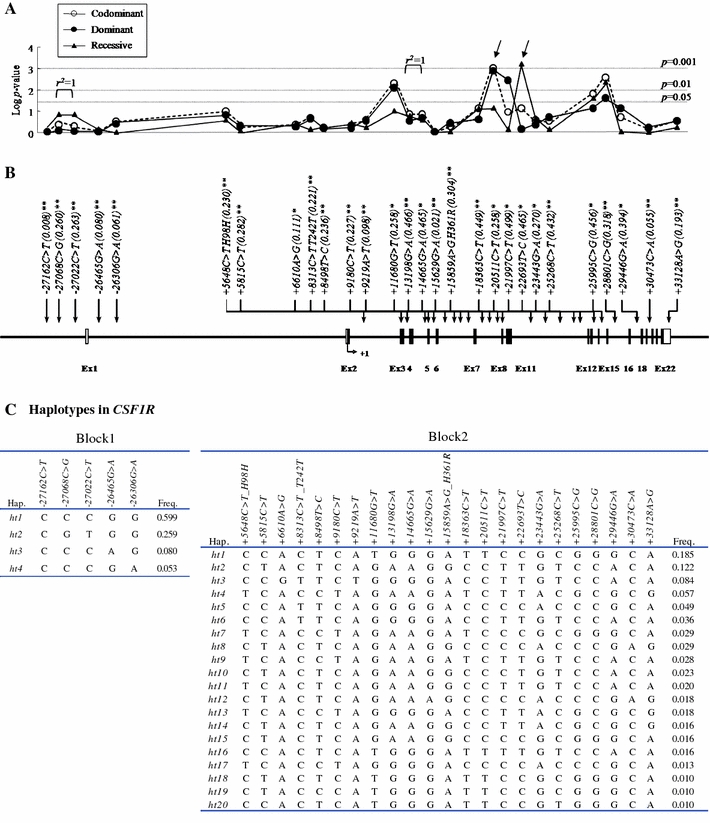
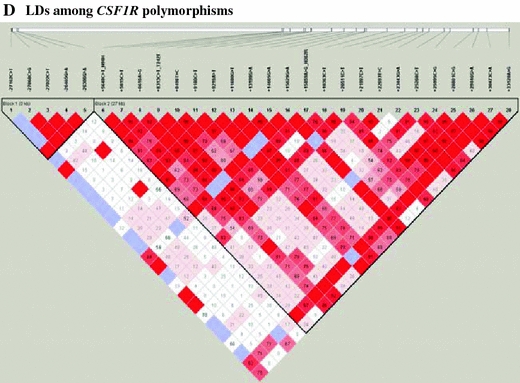
Fig. 1.


Gene map, p value, haplotype list, and linkage disequilibrium of SNPs in the CSF1R gene. a Log p values for the association analysis of SNPs with asthma risk. b Gene map and locations of the SNPs in the CSF1R gene at chromosome 5q33–q35 (60 kb). The first base of the translation start site is denoted as nucleotide +1. The black and white blocks represent the untranslated regions and coding regions of CSF1R, respectively. *polymorphisms selected for large-scale genotyping, considering allele frequencies, locations, and LD after discovery. **SNPs selected in the HapMap database. p values of each SNP were demonstrated in three different models (co-dominant, dominant, and recessive). c Haplotypes of CSF1R. d Linkage disequilibrium coefficient (|D′| and r 2) among CSF1R SNPs
