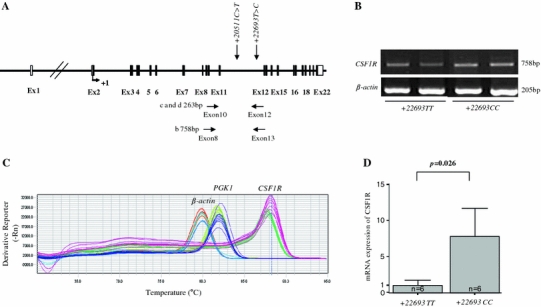
Fig. 3.

Comparison of CSF1R mRNA levels from its SNP subtypes. a Diagram of PCR primers. The RT-PCR product size from exon 8 to exon 13 is 758 bp. The RT-PCR product size from exon 10 to exon 12 is 263 bp. b Neutrophils containing T allele or C allele were harvested, and CSF1R mRNA was measured using RT-PCR. c Melt curve using RT-PCR is shown. d CSF1R mRNA was measured using RT-PCR. Data are expressed as the ratio of CSF1R mRNA over β-actin and PGK1 mRNA. The experiments were performed in duplicate
