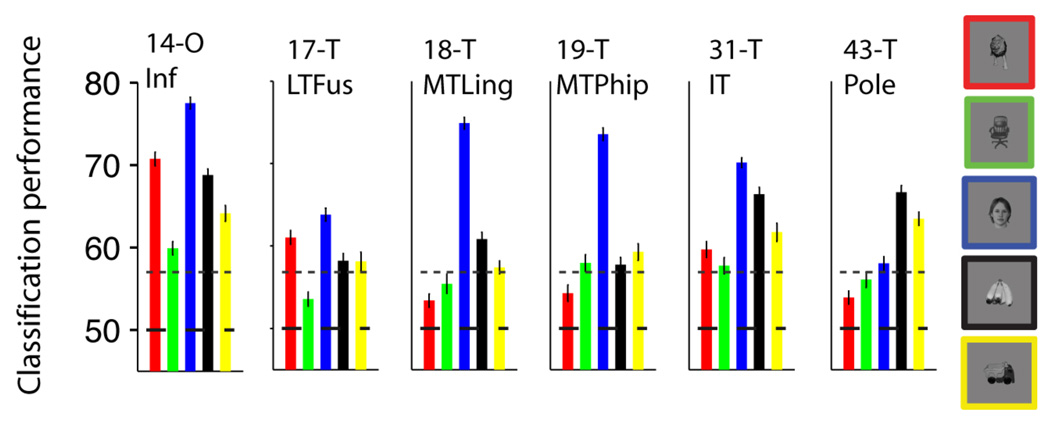
Figure 2. Locations showing strongest selectivity.
Classification performance using neural ensembles from different brain locations. We randomly selected 10 electrodes from the pool of all the electrodes in each location. The subplots show the classification performance using the responses from these neural ensembles for the 6 brain regions that yielded the highest selectivity (see Figure S5 for the ensemble performance values for all other locations). The location codes and names are shown in Table S2. The bar colors denote the object categories (see exemplars on the right). The horizontal dashed line indicates the chance level (50%) and the dotted line shows the statistical significance threshold (Figure S2A).

