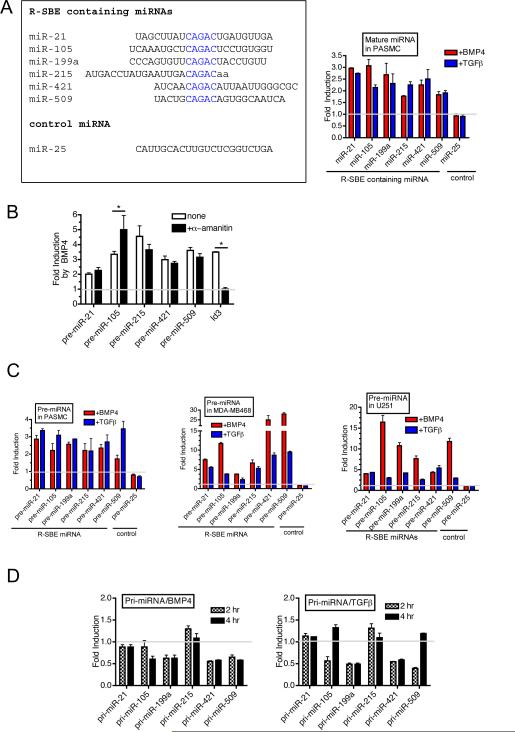
Fig.5. Identification of miRNAs regulated by the TGFβ signaling pathway post-transcriptionally.
A. Sequence alignment of analyzed miRNAs containing R-SBE (left panel). Levels of expression of mature miRNAs, normalized to U6, were examined in PASMCs treated with 3nM BMP4 or 400pM TGFβ1 for 6 hr (right panel). miR-25 does not contain R-SBE and is not regulated by BMP4 or TGFβ1. Fold induction after treatment relative to mock treated PASMC is presented. B. PASMCs were pre-treated with RNA pol II inhibitor α-amanitin for 5 hr followed by treatment with or without 3 nM BMP4 for 2 hr and subjected to qRT-PCR analysis using primers to detect pre-miRNAs or Id3, normalized to GAPDH. Fold change relative to untreated cells is presented. (*P<0.05, compared to no treatment, n=3). C. Human PASMCs, MDA-MB-468 cells, or U251 cells were treated with 3 nM BMP4 or 400 pM TGFβ1 for 2 hr and subjected to qRT-PCR using indicated primers, normalized to GAPDH. The fold induction relative to mock treated sample is presented. D. Time-course expression of indicated pri-miRs, normalized to GAPDH, was examined by qRT-PCR in PASMCs stimulated with 3 nM BMP4 (left panel) or 400 pM TGFβ1 (right panel) for 2 or 4 hr. Fold induction compared to untreated samples are presented. Error bars represent s.e.m. See also supplemental Fig. 4 and supplemental table 5.

