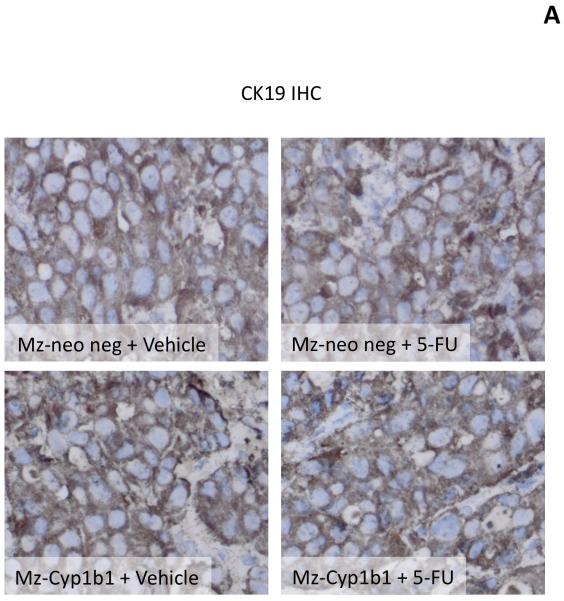
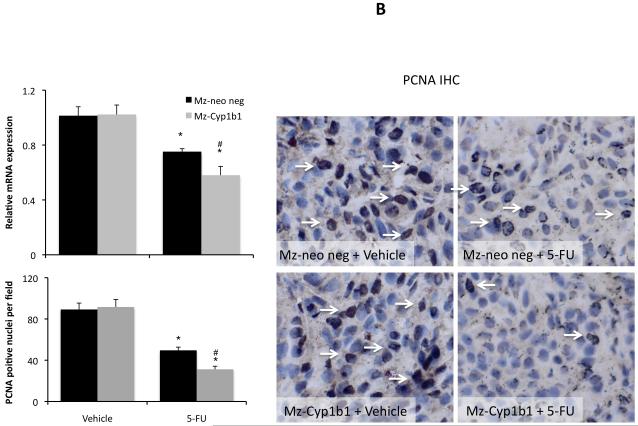
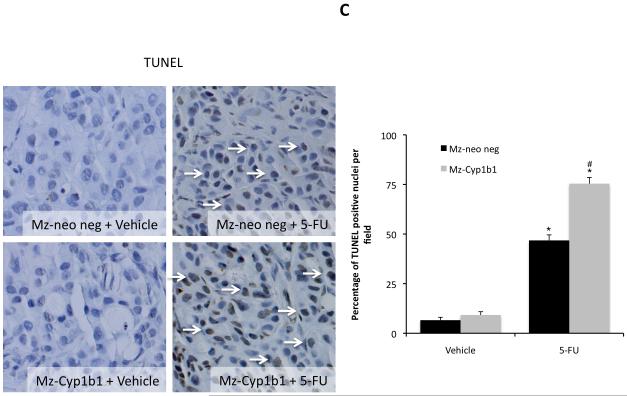
Figure 8.
Immunohistological analysis of tumors. Immunohistochemistry on tumors derived from Mz-Neo neg cells and Mz-Cyp1b1 shRNA cells treated with Vehicle of 5-FU were performed using specific antibodies against CK-19 (A), PCNA (B), and TUNEL (C). Representative photomicrographs of the immunoreactivity are shown (magnification X40) and positive immunoreactivity indicated by arrows. Semi-quantitative analysis of PCNA immunoreactivity was performed and data was expressed as average (± SEM) PCNA positive nuclei per field and also by real time PCR (B). Data are expressed as average ± SEM (n=3). Semi-quantitative analysis of TUNEL positive nuclei was assessed and expressed as average (± SEM) PCNA positive nuclei per field (C). In each case the asterisk denotes significance (p<0.05) compared to the corresponding vehicle-treated tumors and the # denotes significance (p<0.05) from 5-FU-treated tumors derived from the Mz-neo neg cells.


