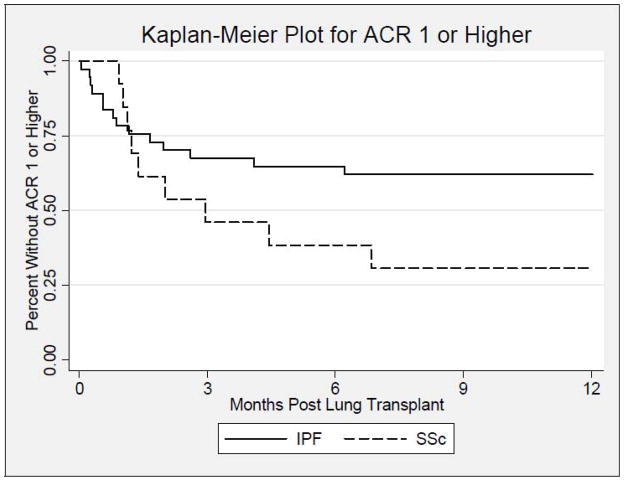
Figure 1.
Kaplan-Meier plot displaying the estimated time to first acute rejection ≥1 for the idiopathic pulmonary fibrosis group [indicated by a solid line (—)] vs. the systemic sclerosis group [indicated by a dashed line (---)], during the first year after lung transplantation. There is no significant difference between groups (log-rank test: p=0.06).

