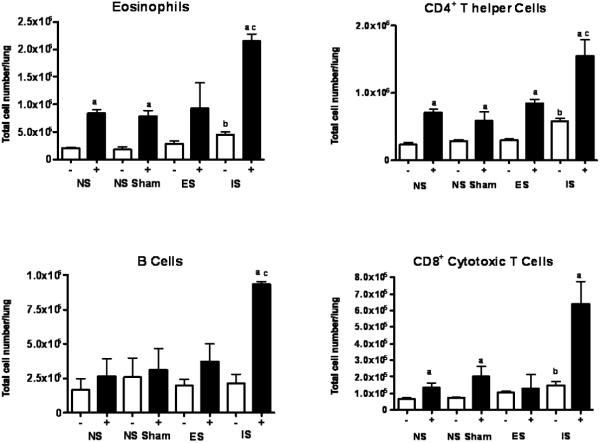
Figure 7. Inescapable stress corresponds with a distinct leukocyte and eosinophil accumulation in lung.
The phenotype and distribution of leukocytes and eosinophils in the lung was determined by flow cytometry. Data represents mean (n=3) independent experiments ± std. error. (*) denotes significant (p ≤ 0.05) difference in total cell number between between NS; no stress, NS Sham; sham-treated, ES; escapable and IS; inescapable groups.

