
Fig. 1.
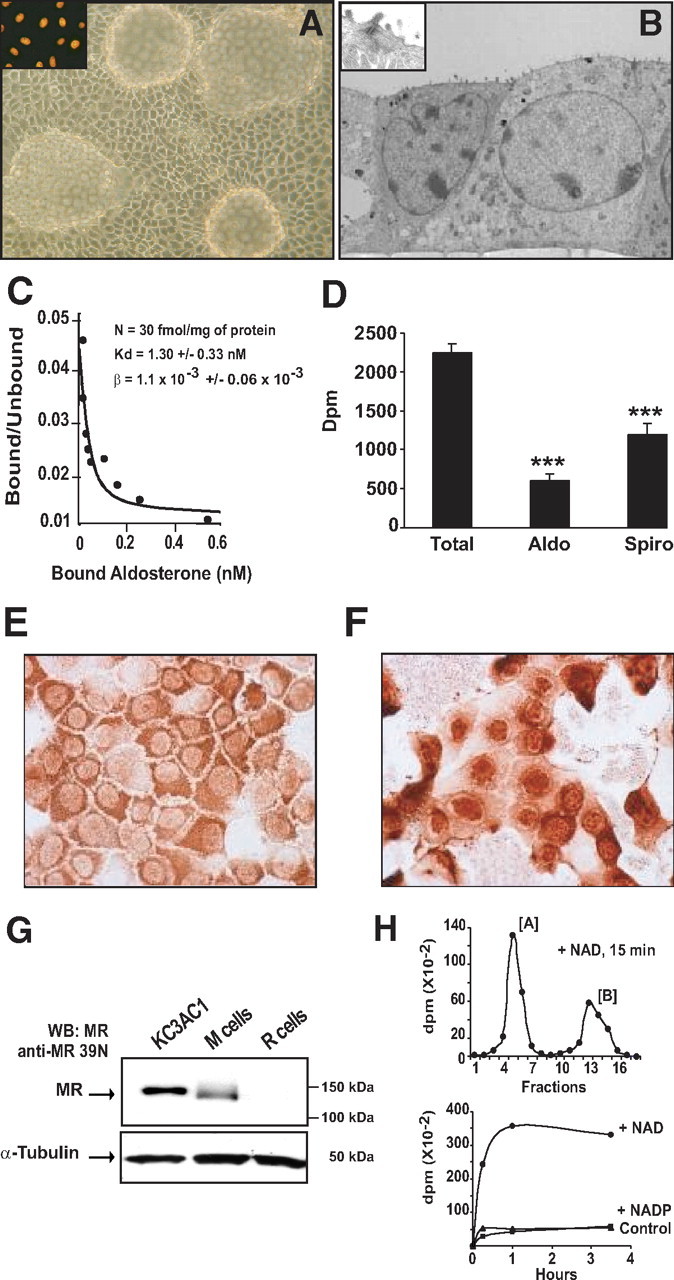
Expression of functional MR in the immortalized KC3AC1 cell line. A, Phase-contrast micrograph of confluent KC3AC1 cells grown on a petri dish coated with collagen I (passage 6). Cells form islets of characteristic epithelial cells and rapidly develop large and numerous domes, suggesting vectorial transepithelial hydroelectrolytic transport (optical lens, ×20). Strong nuclear immunostaining was observed in all cells with a monoclonal anti-TAg antibody, confirming that KC3AC1 cells are immortalized (inset). B, Electron microscopic micrographs of KC3AC1 cells grown on filters forming monolayers of epithelioid cells and presenting microvilli at the apical side of the membrane and a desmosome (see inset). C, Scatchard analysis. Cytosolic fractions of KC3AC1 cells (passage 9) were incubated with increasing concentrations of [3H]aldosterone for 4 h at 4 C. Bound (B) and unbound (U) hormone were separated by the charcoal-dextran technique. U was calculated as
(Continued) the difference between total and bound hormone concentration. The curve was simulated from the best model of interaction (B = nU/(Kd + U) + βU), where n is the maximum number of specific binding sites, Kd is the dissociation constant, and β is the constant of nonspecific binding. Mean values are given with the corresponding intraexperimental sd. Experimental points are means of triplicate determinations. D, whole-cell binding. Cells were incubated in MM 24 h before the experiment. Then, 10 nm [3H]aldosterone with and without a 100-fold excess of unlabeled aldosterone (Aldo) or spironolactone (Spiro) was added to cells. After 1 h of incubation at 37 C, cells were rinsed twice with ice-cold PBS, lysed with cold ethanol, and the radioactivity was counted. Data represent means ± sem of three independent determinations. Statistical significance: ***, P < 0.001. E, F, Immunocytochemical detection of MR in KC3AC1 cells incubated in the absence (C) or presence of 10 nm aldosterone for 30 min (D). Note the presence of cytoplasmic labeling when cells were incubated in MM and nuclear labeling in presence of the ligand. G, Western blot analysis of MR expression in KC3AC1 cells. Twenty to 30 μg of proteins from KC3AC1 cell homogenates were processed for immunoblotting with anti-MR 39N antibody. Note the presence of a band of approximately 130 kDa in KC3AC1 cell lysates. This band was clearly immunodetected in M-cell lysates, which stably overexpress MR, but were absent in the parental RCSV3 cell lysates, which do not express MR. H, HPLC analysis. Cells were incubated for 1 h with 10 nm [3H]corticosterone [B], and time-dependent production of [3H]dehydrocorticosterone [A] was measured by HPLC and the radioactivity of each fraction was counted. Top, Typical chromatogram obtained after HPLC analysis. Compound [B] was recovered between fractions 12 and 16, whereas compound [A] was recovered between fractions 4 and 7. Bottom, Cofactor specificity of 11βHSD2 activity was assessed in permeabilized KC3AC1 cells after incubation with 10 nm [3H]corticosterone in the absence or presence of 1 mm NADP or 1 mm NAD.