
Fig. 3.
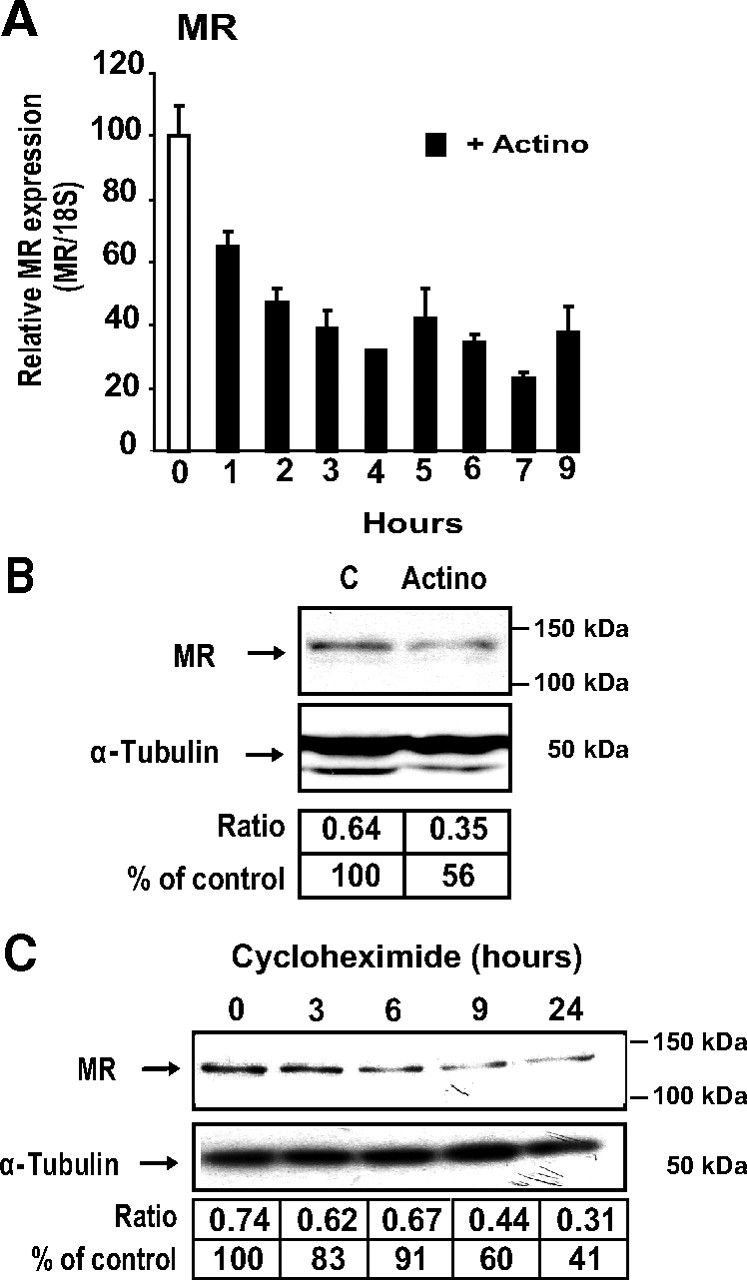
Analysis of MR transcript and protein stability. A, Analysis of MR transcript by qRT-PCR. Differentiated KC3AC1 cells were incubated for various periods of time in the absence or in the presence of 0.4 μm actinomycin D. Total RNA was extracted and processed for qRT-PCR. Results were normalized by the amplification of 18S RNA and were expressed as relative to the control. B and C, Western blot analysis of MR expression in KC3AC1 cells. B, Differentiated KC3AC1 cells were incubated for 18 h in the absence or in presence of 0.4 μm actinomycin D. C, Differentiated KC3AC1 cells were incubated for various periods of time in the absence or in the presence of cycloheximide (5 μg/ml). Twenty micrograms of protein from KC3AC1 cell homogenates were processed for immunoblotting with anti-MR 39N antibody (1/2000). α-Tubulin was used as loading control. MR was normalized to α-tubulin protein levels after digitalization on a gel scanner by use of QuantityOne software (Bio-Rad, Marnes-la-Coquette, France). Results are presented as ratio MR/α-tubulin and as percentage of control.