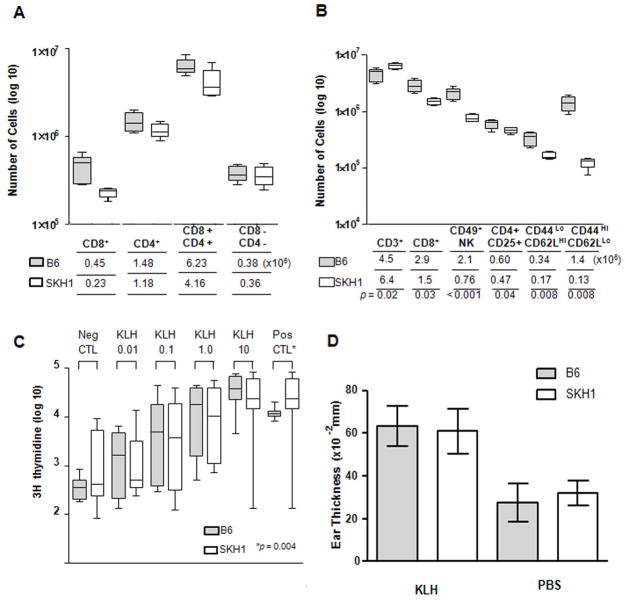
Figure 3. Cellular Immunity of SKH1 vs. B6 mice.
A, Thymus cell counts for T cell subpopulations. No statistical differences were found. B, Peripheral (splenic) cell counts for CD3 T cells, CD8 T cells, CD49+ Natural Killer (NK) cells, CD4+CD25+ regulatory T cells, CD44Lo CD62LHI naïve T cells and CD44HI CD62LLo memory T cells. C, ex vivo leukocyte proliferation following KLH immunization. D, in vivo immune response following KLH immunization (no significant difference was seen between B6 and SKH1 mice). Data presented in (A) or (B) are absolute numbers of cells per thymus or spleen, respectively. For all experiments, B6 n=5; SKH1 n=5

