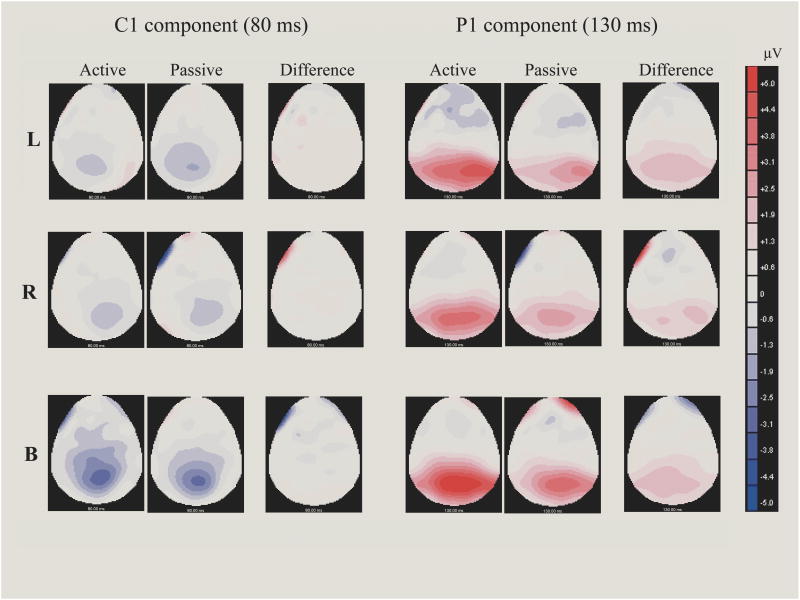
Figure 3.
The scalp voltage maps of the C1 (80 ms) and P1 (130 ms) components for the left, right, and bilateral stimuli under the active and passive viewing conditions. The difference maps showed the scalp distribution of the difference waveform, which were obtained by subtracting ERPs under the passive viewing condition from ERPs under the active viewing condition. It can be seen that C1 shows no attentional effect (left panels), whereas P1 is larger under the active viewing condition (right panels). It is also clear that bilateral stimuli enhance the C1 component.

