
Figure 1. Discrimination between frequent polymorphisms and disease mutations with PolyPhen-2 score.
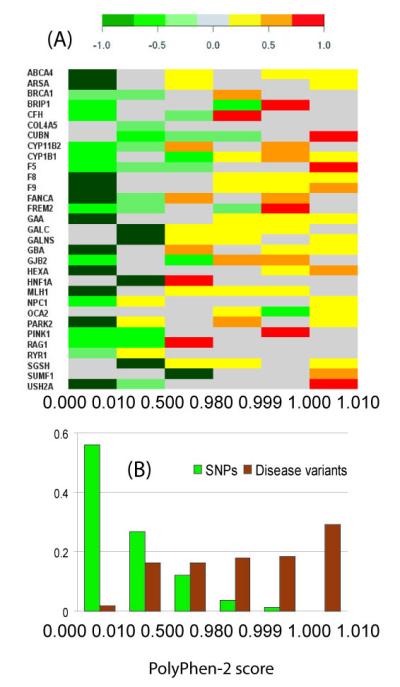
31 human genes were selected so that for each gene exists (i) at least one non-synonymous SNP listed in UniProt with minor allele frequency reaching at least 15% in one population; (ii) at least one disease-associated sequence variant annotated in the UniProt database; (iii) clinical genetic testing reviewed in NCBI GeneTests database (URL:http://www.ncbi.nlm.nih.gov/sites/GeneTests/review/) Hemoglobin beta was not included. The total set includes 499 disease variants and 82 SNPs (see Supplementary Table 1 for the detailed list). PolyPhen-2 score is based on the Naïve Bayes posterior probability with larger values reflecting the higher likelihood of a variant to be damaging [10]. The score value range was split into six bins including marginal values 0, 1 and four intermediate approximately equipopulated intervals. (A) The plot of the fraction of disease mutations minus the fraction of SNPs for each gene and score interval. As shown by the color code above, the green colors depict the prevalence of SNPs and the red colors the prevalence of disease mutations, respectively. (B) The histogram of SNPs and mutations populating each interval for all genes.