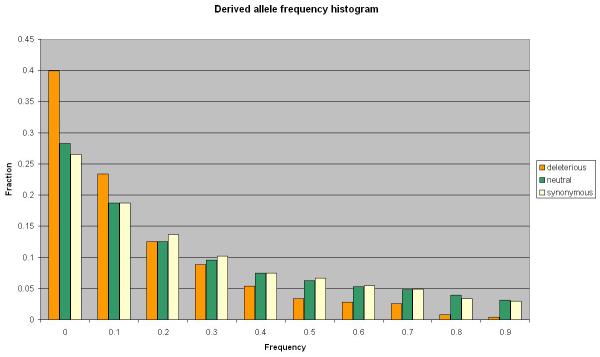
Figure 2. Allele frequency distribution.
The figure shows the derived allele frequency distribution for the three groups of polymorphisms from dbSNP database: 6337 coding synonymous SNPs (light yellow), 4687 non-synonymous SNPs predicted as benign by PolyPhen-2 (green), and 1301 non-synonymous SNPs predicted damaging by PolyPhen-2 (orange). The frequencies were measured in HAPMAP-YRI population (120 individuals).

