Figure 1. 5-HT production in islets during pregnancy.
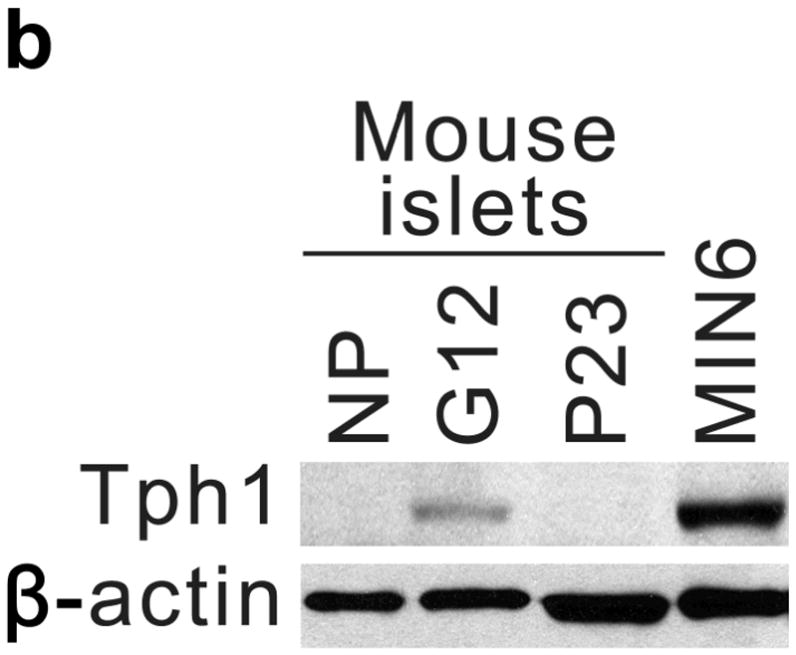
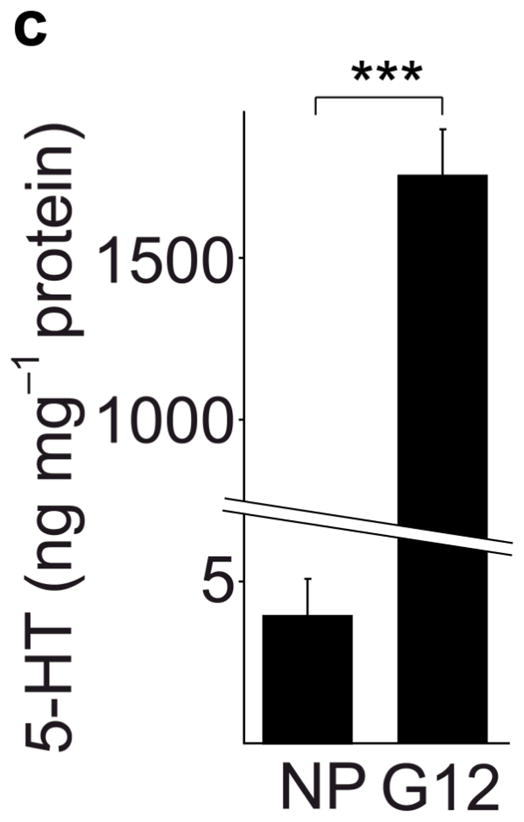
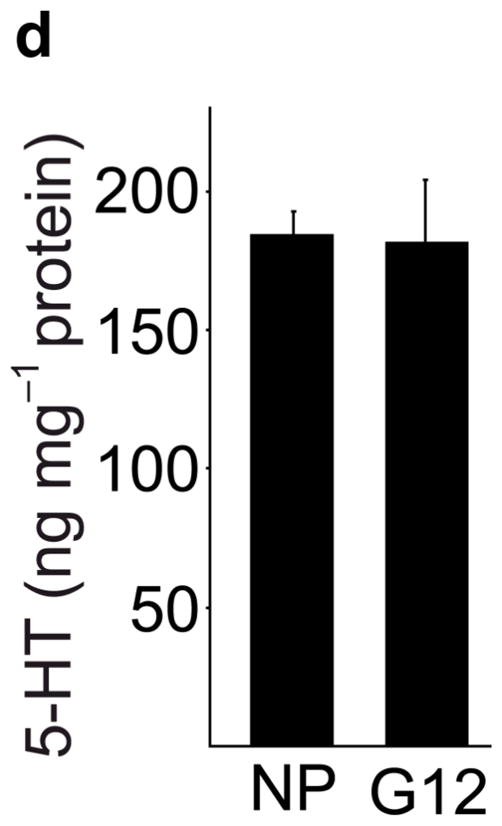
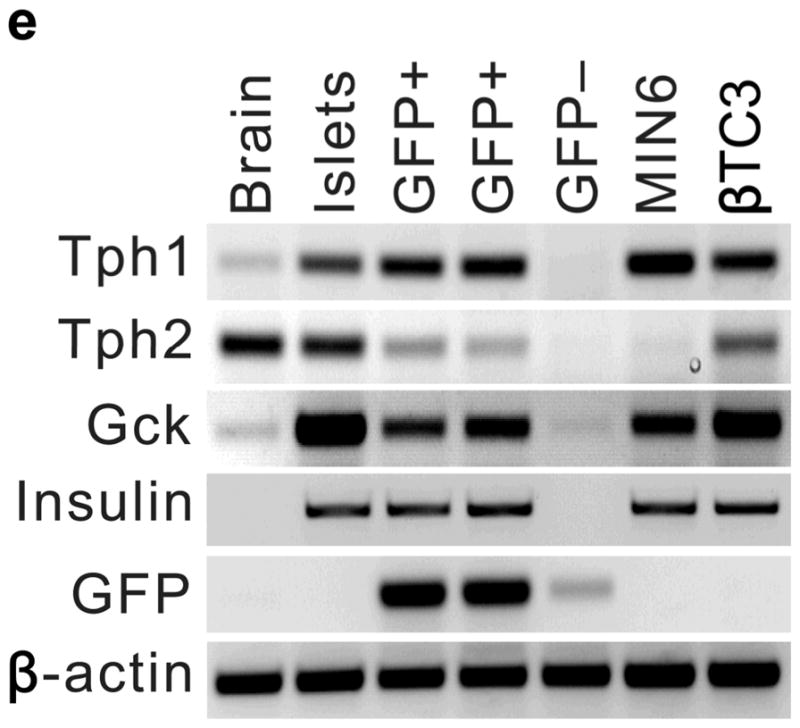
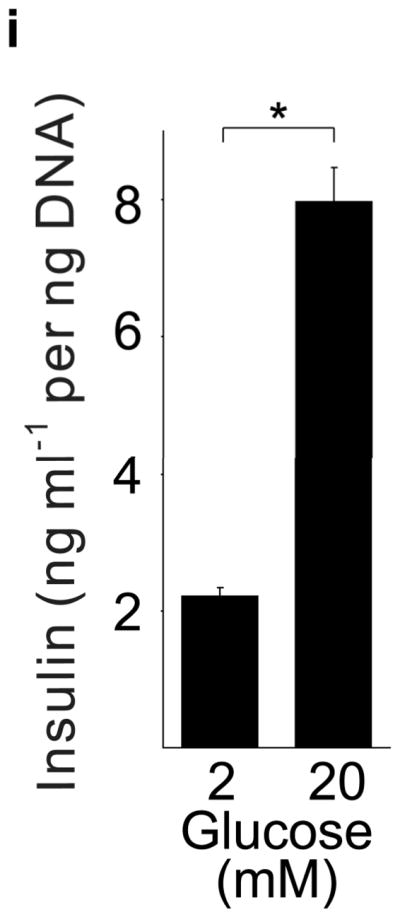
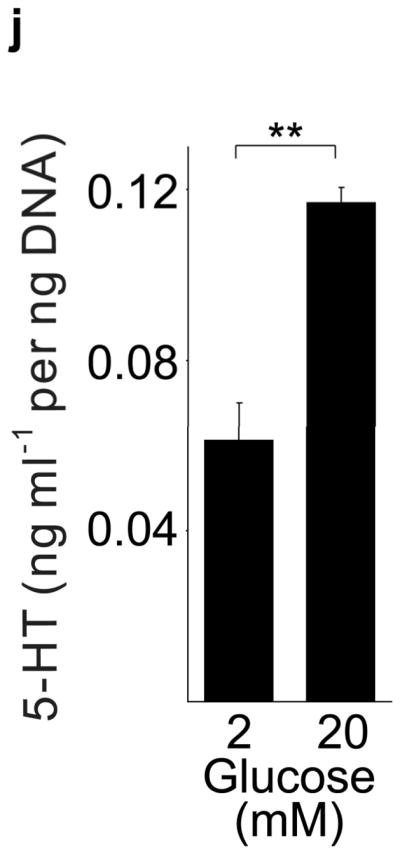
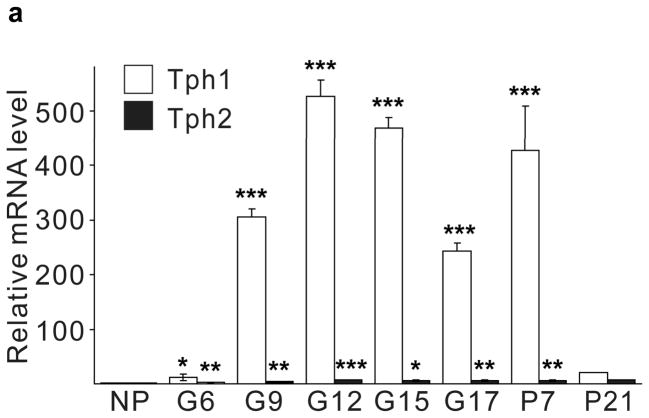
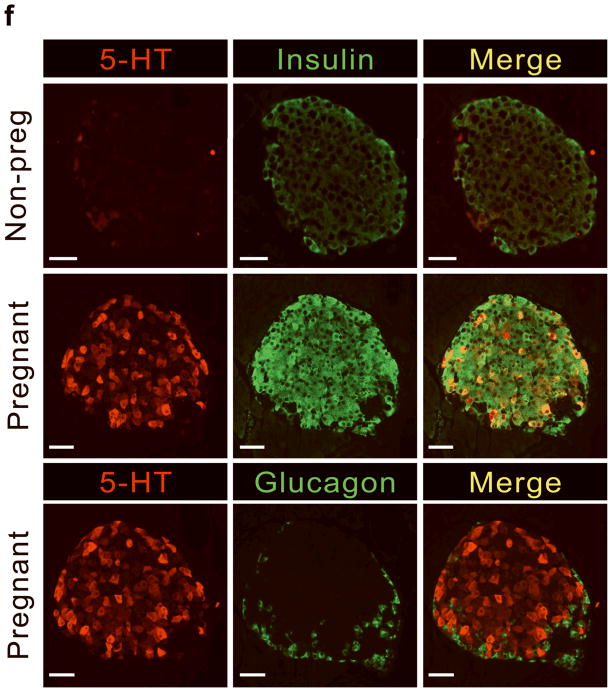
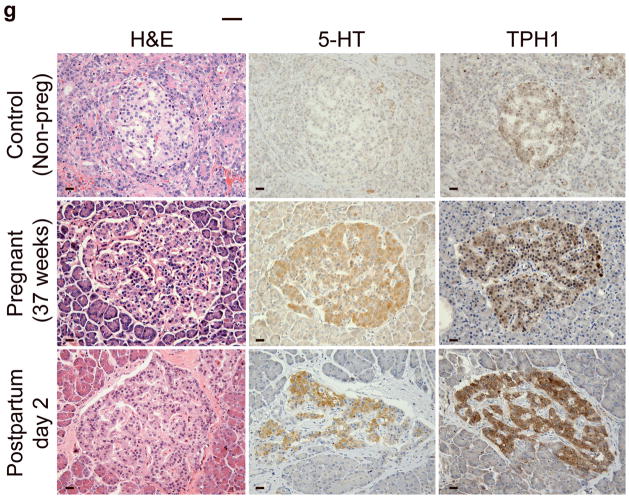
(a) mRNA levels for Tph1 and Tph2 measured by real time RT-PCR in islet RNA at the dates of gestation (G) or postpartum (P) indicated are shown relative to the levels in islets from non-pregnant female mice. n = 3 6 mice per data point. (b) Western blots were performed with Tph1 and β-actin antisera on protein extracted from islets of non-pregnant female (NP), pregnant (G12) and postpartum day 23 (P23) female mice and MIN6 insulinoma cells. (c, d) Tissue 5-HT concentrations were assayed by HPLC in islets (c) and duodenum (d) isolated from 3 non-pregnant (NP) and 3 pregnant (G12) female mice. (e) The mRNA shown were amplified by RT-PCR from mouse islets, β-cells (GFP+), non-β islet cells (GFP−), brain, and the β-cell lines MIN6 and βTC3. (f) Immunofluorescent staining labels pancreata from non-pregnant female (Non-preg) and G12 pregnant mice with insulin and glucagon in green and 5-HT in red. (g) Immunoperoxidase staining labels 5-HT and TPH1 in pancreata from non-pregnant (Non-preg), pregnant (37 weeks gestation) and postpartum day 2 human autopsies. (h) Immunohistochemical co-staining labels insulin (red, fluorescent) and TPH1 (black, peroxidase) in pregnant human autopsy pancreas. (i, j) Secreted insulin (i) and 5-HT (j) was assayed by ELISA (i) and HPLC (j), following a 1 hour incubation of islets isolated from pregnant (G13 G15) mice in 2 mM or 20 mM glucose. n = 5 groups of 40 islets. All data are presented as mean ± standard error. Statistical significance vs. islets cultured in 2mM glucose (i and j) or vs. non-pregnant control (a and c) was analyzed by Student’s t test: *, P < 0.05; **, P < 0.01; ***, P < 0.001. Scale bar indicates 20 μm.

