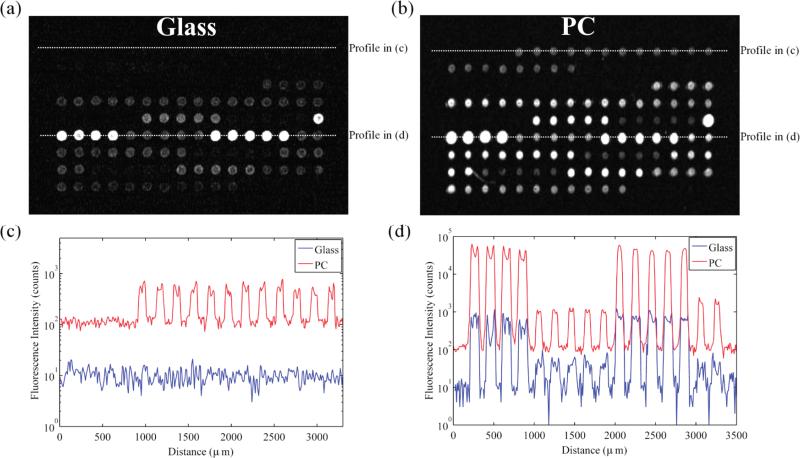
Figure 3.
Fluorescence images at identical gains of a single identical microarray grid on glass (a) and PC (b), with brightness and contrast adjustment to make the maximum number of spots visible on both images. For comparison of spot intensities, line profiles of identical locations on the grid for glass and PC are illustrated on the same plots. Lower expression genes appear in (c) and higher expression genes appear in (d).

