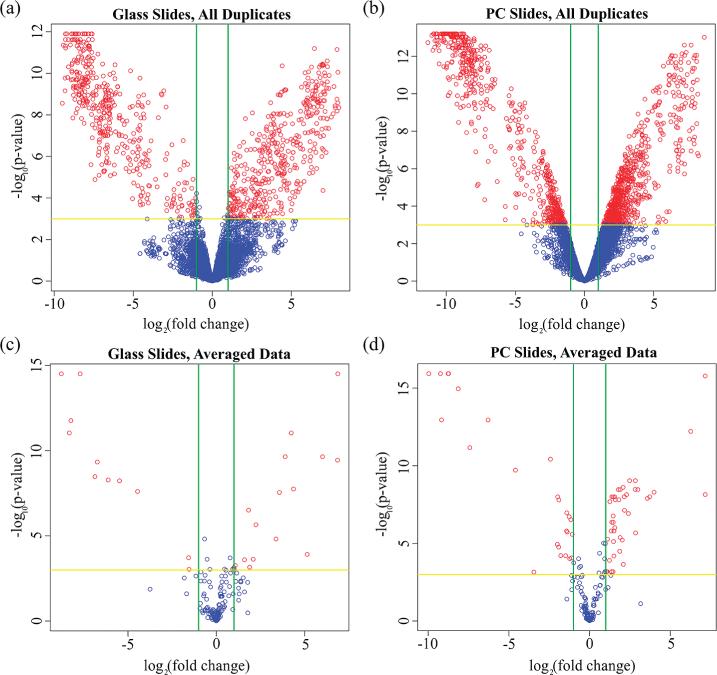
Figure 5.
Volcano plots detailing the relationship between fold-change and inverse p-value to assess differential expression between the trifoliate and cotyledon samples, with positive fold changes indicating increased trifoliate expression and negative fold changes indicating increased cotyledon expression. Green vertical lines represent the 2-fold change cutoff, and the yellow horizontal line denotes a p-value cutoff of 0.05. Genes meeting both thresholds are indicated by red spots. Unaveraged data representing all 7680 spots across all experimental slides (3 replicates per tissue) appear in (a) for the glass slides and (b) for the PCs, with 865 spots differentially expressed on glass slides and 1431 spots on the PCs. Averaging within-slide repeats condensed the data to 192 distinct genes and controls, which appear in (c) for the glass slides and (d) for the PCs. Of the 192 genes probed, 27 were classified as differentially expressed on the glass slides, while 68 met this classification on the PCs.

