
Figure 4.
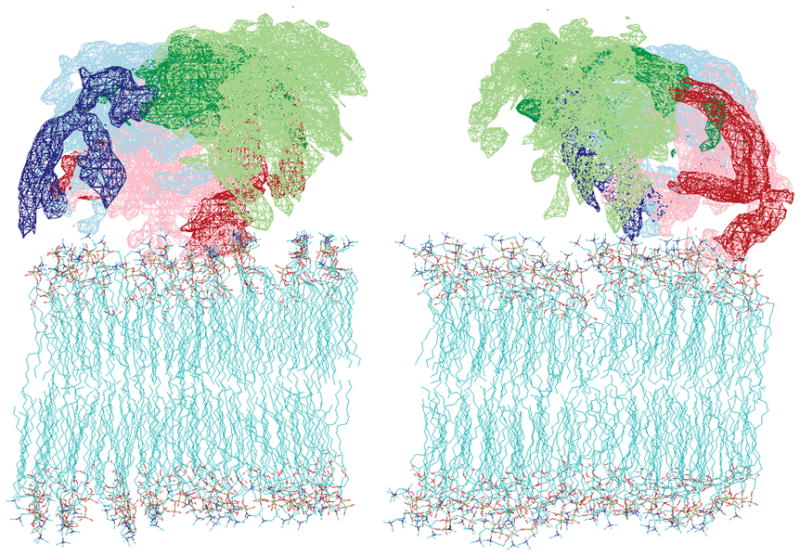
Reweighted atomic density maps of the C-terminal domain (Glu17 to Leu177) showing the space on the membrane surface that is sampled by the 3 dynamic states. The maps are created from the 44 lowest-energy N=3 structures from 200 calculations. Only backbone atoms are used for density calculation. The all-backbone-atom maps for the 3 states are colored in light blue, light green, and pink. The switch region densities for the corresponding states are colored in darker blue, green, and red. The right and left views are related by a 90° rotation around the bicelle norm.