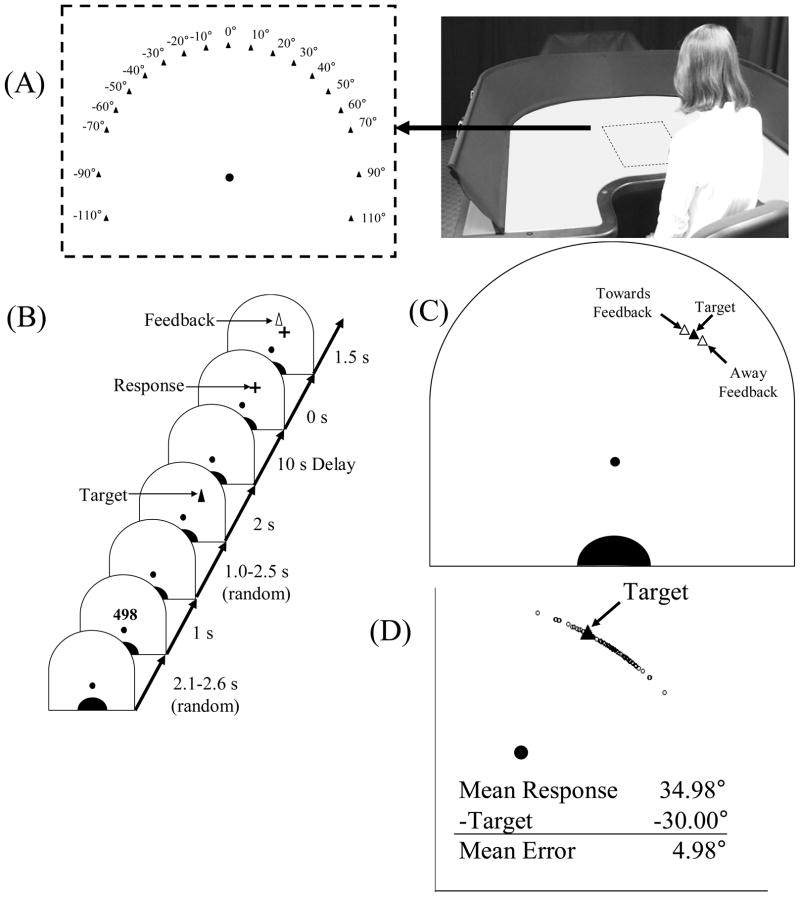
Figure 1.
(A) Target distribution (left panel) and apparatus (right panel) used for the spaceship task. The black disc at the origin of the target distribution corresponds to the yellow reference disc used in the experiment. Targets were projected onto the table from beneath. Lights were dimmed during the experiment and the table appeared black. (B) Time line of the experimental procedure. (C) Sample target location (30°) along with feedback biased either 4° towards the vertical axis (Towards condition) or 4° away from the vertical axis (Away condition). (D) Mean error calculation method demonstrated here using the response distribution for the ±30° target in the Away condition in Block 2 (all subjects) as an example.

