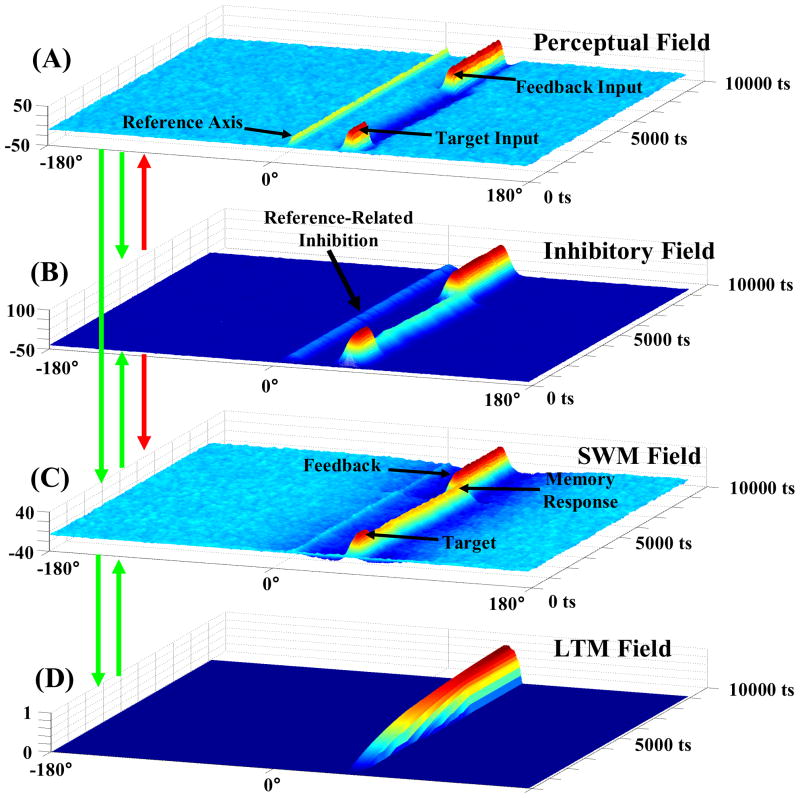
Figure 3.
Simulation of the Dynamic Field Theory. Panel (A) represents the perceptual field, panel (B) the shared inhibitory field, panel (C) the spatial working memory (SWM) field, and panel (D) the long-term memory field. Green arrows indicate excitatory connections between fields. Red arrows indicate inhibitory connections. In each layer, spatial location (°) is represented along the X axis, time along the Y axis, and activation along the Z axis. The trial begins at the front of the figure and moves towards the back. See text for additional details.

