
Figure 2.
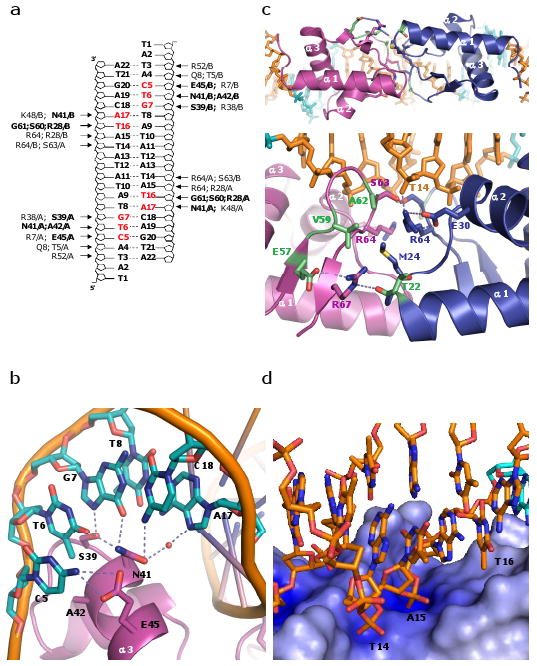
The E. coli LexA-DNA binding. (a) Schematic representation of protein-DNA interactions observed in the LexA-DNA structure. Amino acid residues in bold and bases highlighted in red represent interactions with the bases. Remaining amino acid residues contact the DNA phosphodiester backbone. (b) Detailed of contacts with the consensus sequence. In addition to the hydrogen bonds shown as dotted lines, there is a van der Waals interaction between A42 and the methyl group of T6. (c) Interface between DNA binding domains. Top: viewed from the catalytic domains, and bottom: expanded and rotated ∼90° about a horizontal axis. Residues that appear to make key protein-protein contacts are shown as sticks, and those whose mutations enhanced DNA binding are highlighted in green (specifically, T22I, E57K, V59I, and A62T or V13). (d) Zoomed in view of the electrostatic potential surface map of the wing region. The main chain amide group of S63 and guanidine groups of R64 and R28 interact with the phosphate groups of T14 and A15. The side chains of R28, P40, and E44 form a hydrophobic pocket that stabilizes the methyl group of T16. The electrostatic potential at the protein surface was calculated with APBS, and the color scale ranges from -10kT/e (bright red) to +10kT/e (dark blue)29.