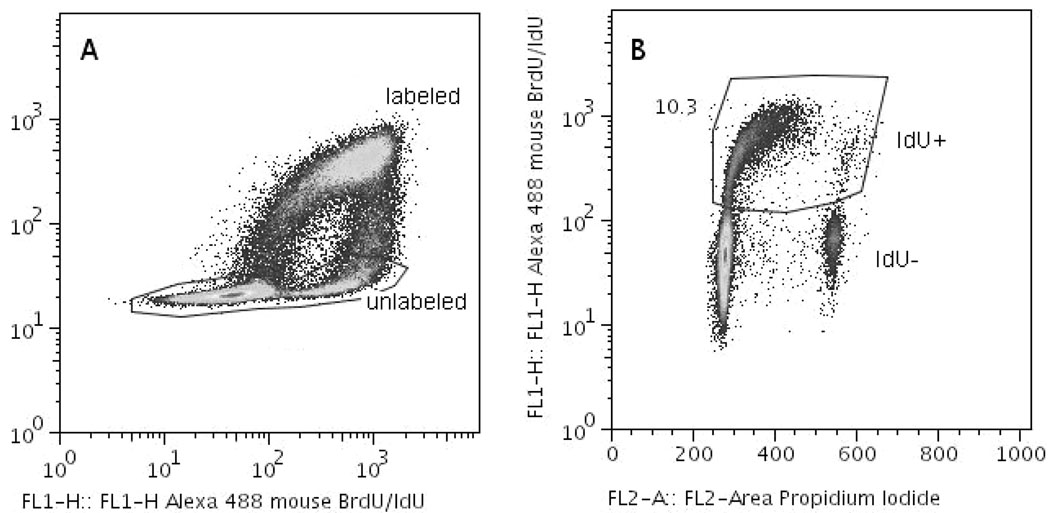
Figure 1.
Multi-parameter flow cytometric analysis of CLI in AG1522 Cytomatrix cultures pulse-labelled with 3HdC. (A) Bivariate pseudo-colour plot of BrdU specific vs. BrdU/IdU immunofluorescence. The events gated out as negative for BrdU (unlabelled bystander cells) are plotted in (B) as a bivariate plot of IdU specific fluorescence vs. DNA content (Propidium Iodide fluorescence). In this example, the number shown by the gated region in panel B is the CLI for bystander cells 18 h after exposure to IdU.

