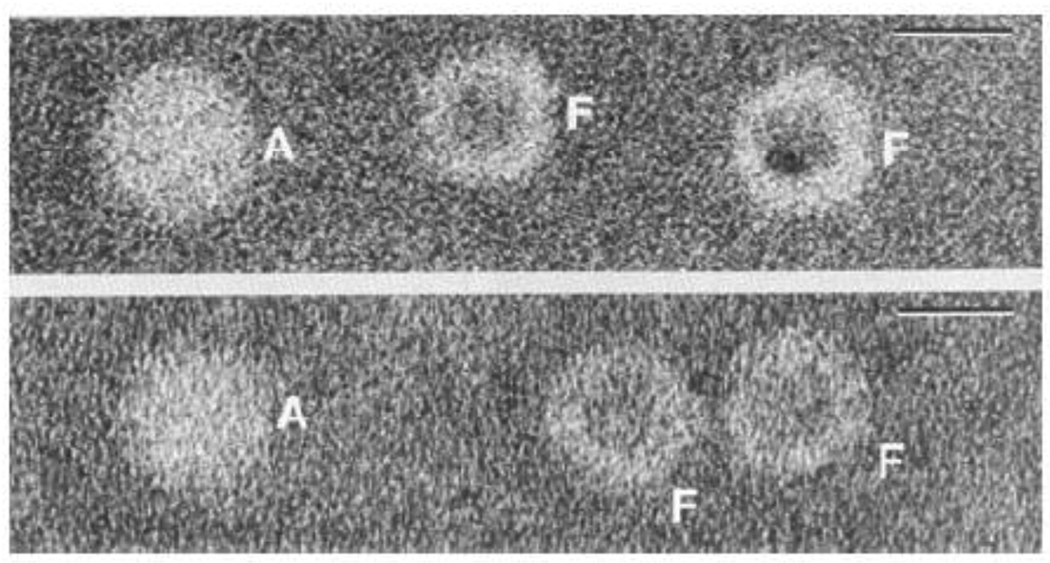
Fig. 10.
Transmission electron micrographs of horse spleen ferritin samples negatively stained with sodium silicotungstate. Upper: Micrograph of a natural ferritin sample showing both apoferritin (A) and ferritin (F) molecules. Lower: A chemically prepared apoferritin sample showing an apoferritin molecule (A) on the left and some ferritin molecules (F) on the right with some of the iron core removed. The diameter of the shell of the apoferritin (A) molecule is seen to be about 12% larger than that of the ferritin (F) molecule. Bar = 10 nm in the upper right hand corner. Adapted and modified from reference [81] with permission. Additional TEM images showing contraction of the protein shell can be found in reference [63].

