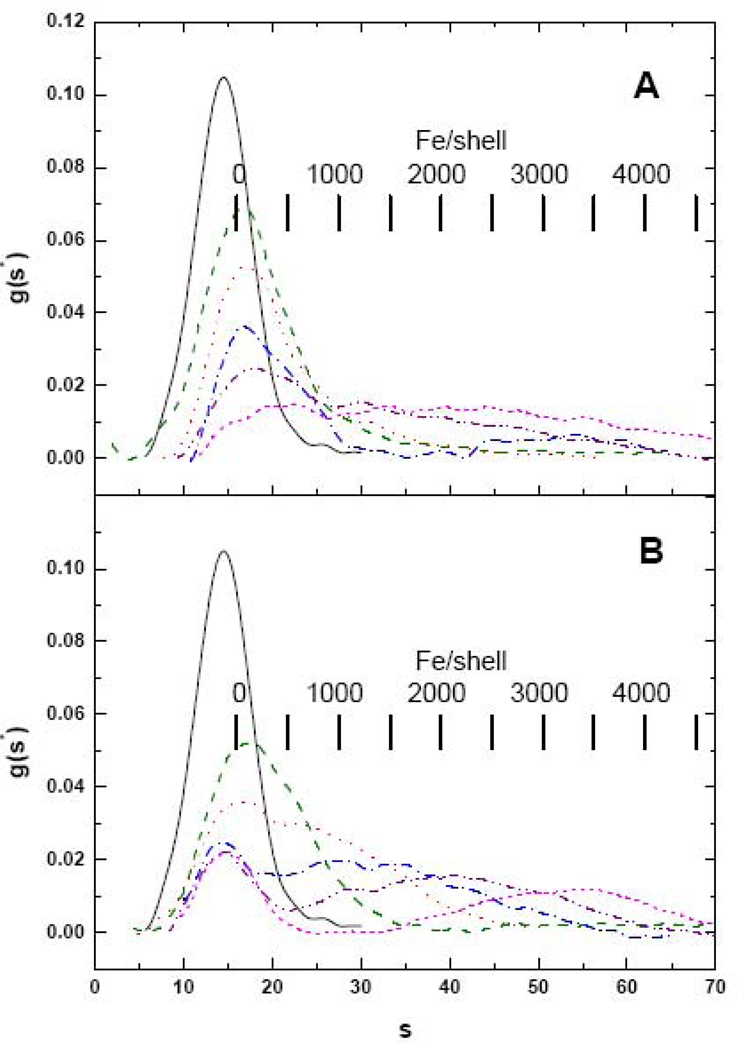
Fig. 4.
Sedimentation velocity profiles of HoSF loaded either in one bolus (panel A) or in increments of 50 Fe/shell per bolus (panel B). In each panel data are shown for Apo-HoSF (black –) and for HoSF exposed to a total of 500 (green – –), 1000 (red ˙˙˙), 1500 (blue -˙-), 2000 (purple -˙˙-) or 2500 (magenta ---) Fe/shell. Sample conditions are as described in Fig. 3.

